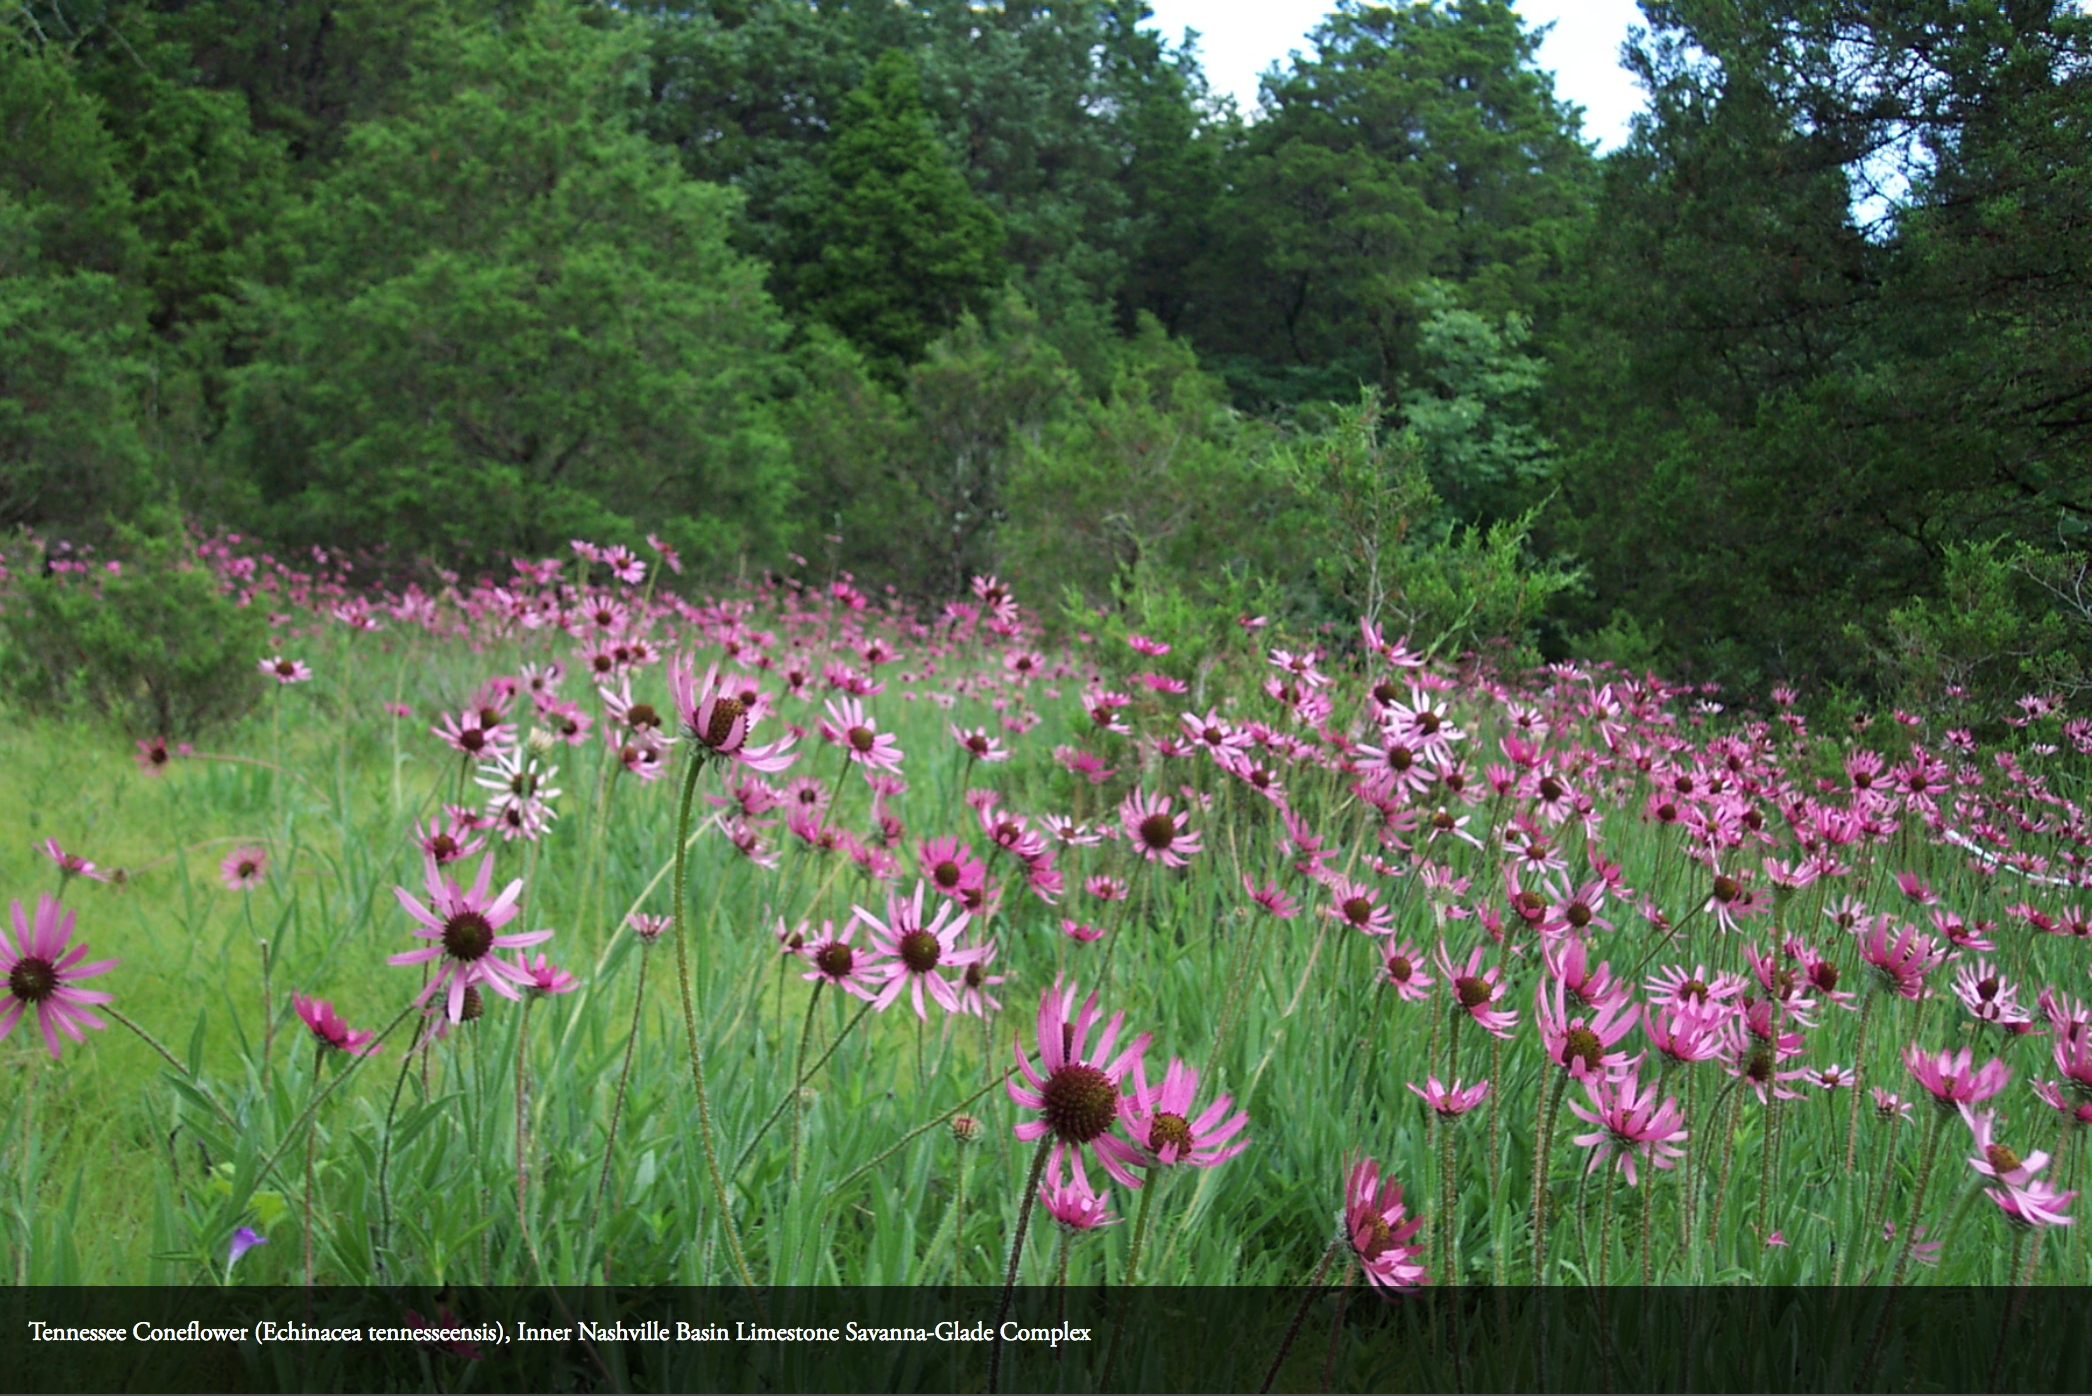
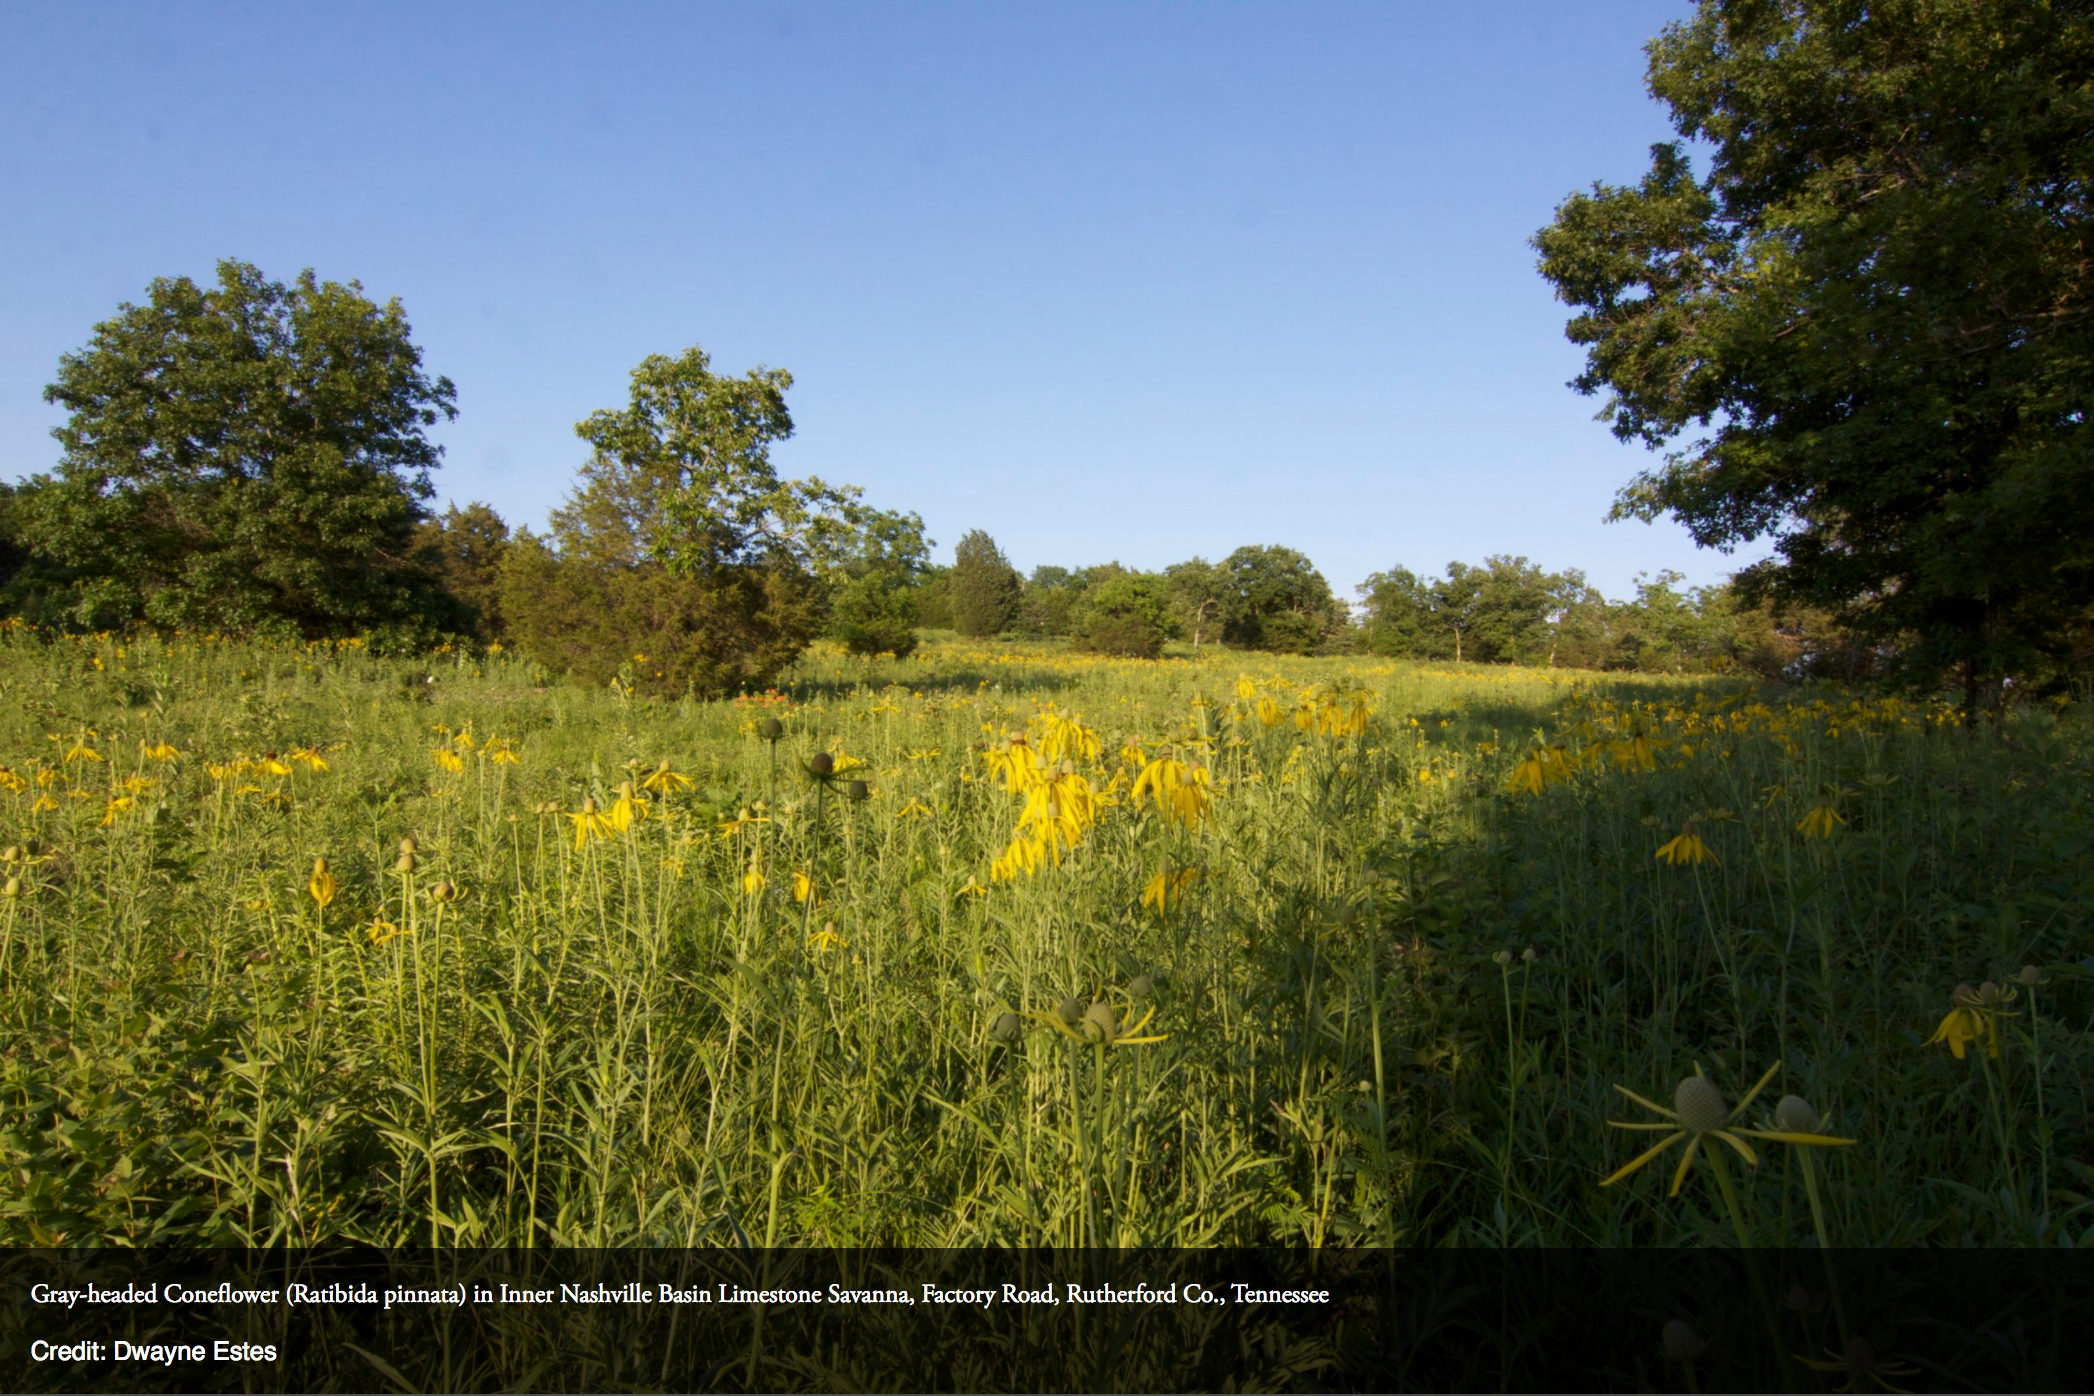
The Southeastern Grasslands Portal: Grasslandia
Grasslandia is SGI’s name for our vision of creating an integrated database and tool for application in the field that will not only provide the most up-to-date information on our current native grasslands, but also provide a portal to a different time and place, allowing us to envision a grassland’s past condition and extent. The database will tie all of the information on southeastern native grasslands—both information that we now have scattered throughout different databases and locations, as well as new information as it is captured by SGI volunteers and partners—to its location on the ground. Grasslandia will also use iNaturalist and a custom-made data-entry tool for documenting new sites to readily incorporate new data into the system.
•Explore Grasslandia
•Vegetation Mapping (done remotely)
•Identification of Grassland Communities
•Database of Grassland Species
•Documentation of New Sites
I. Explore Grasslandia
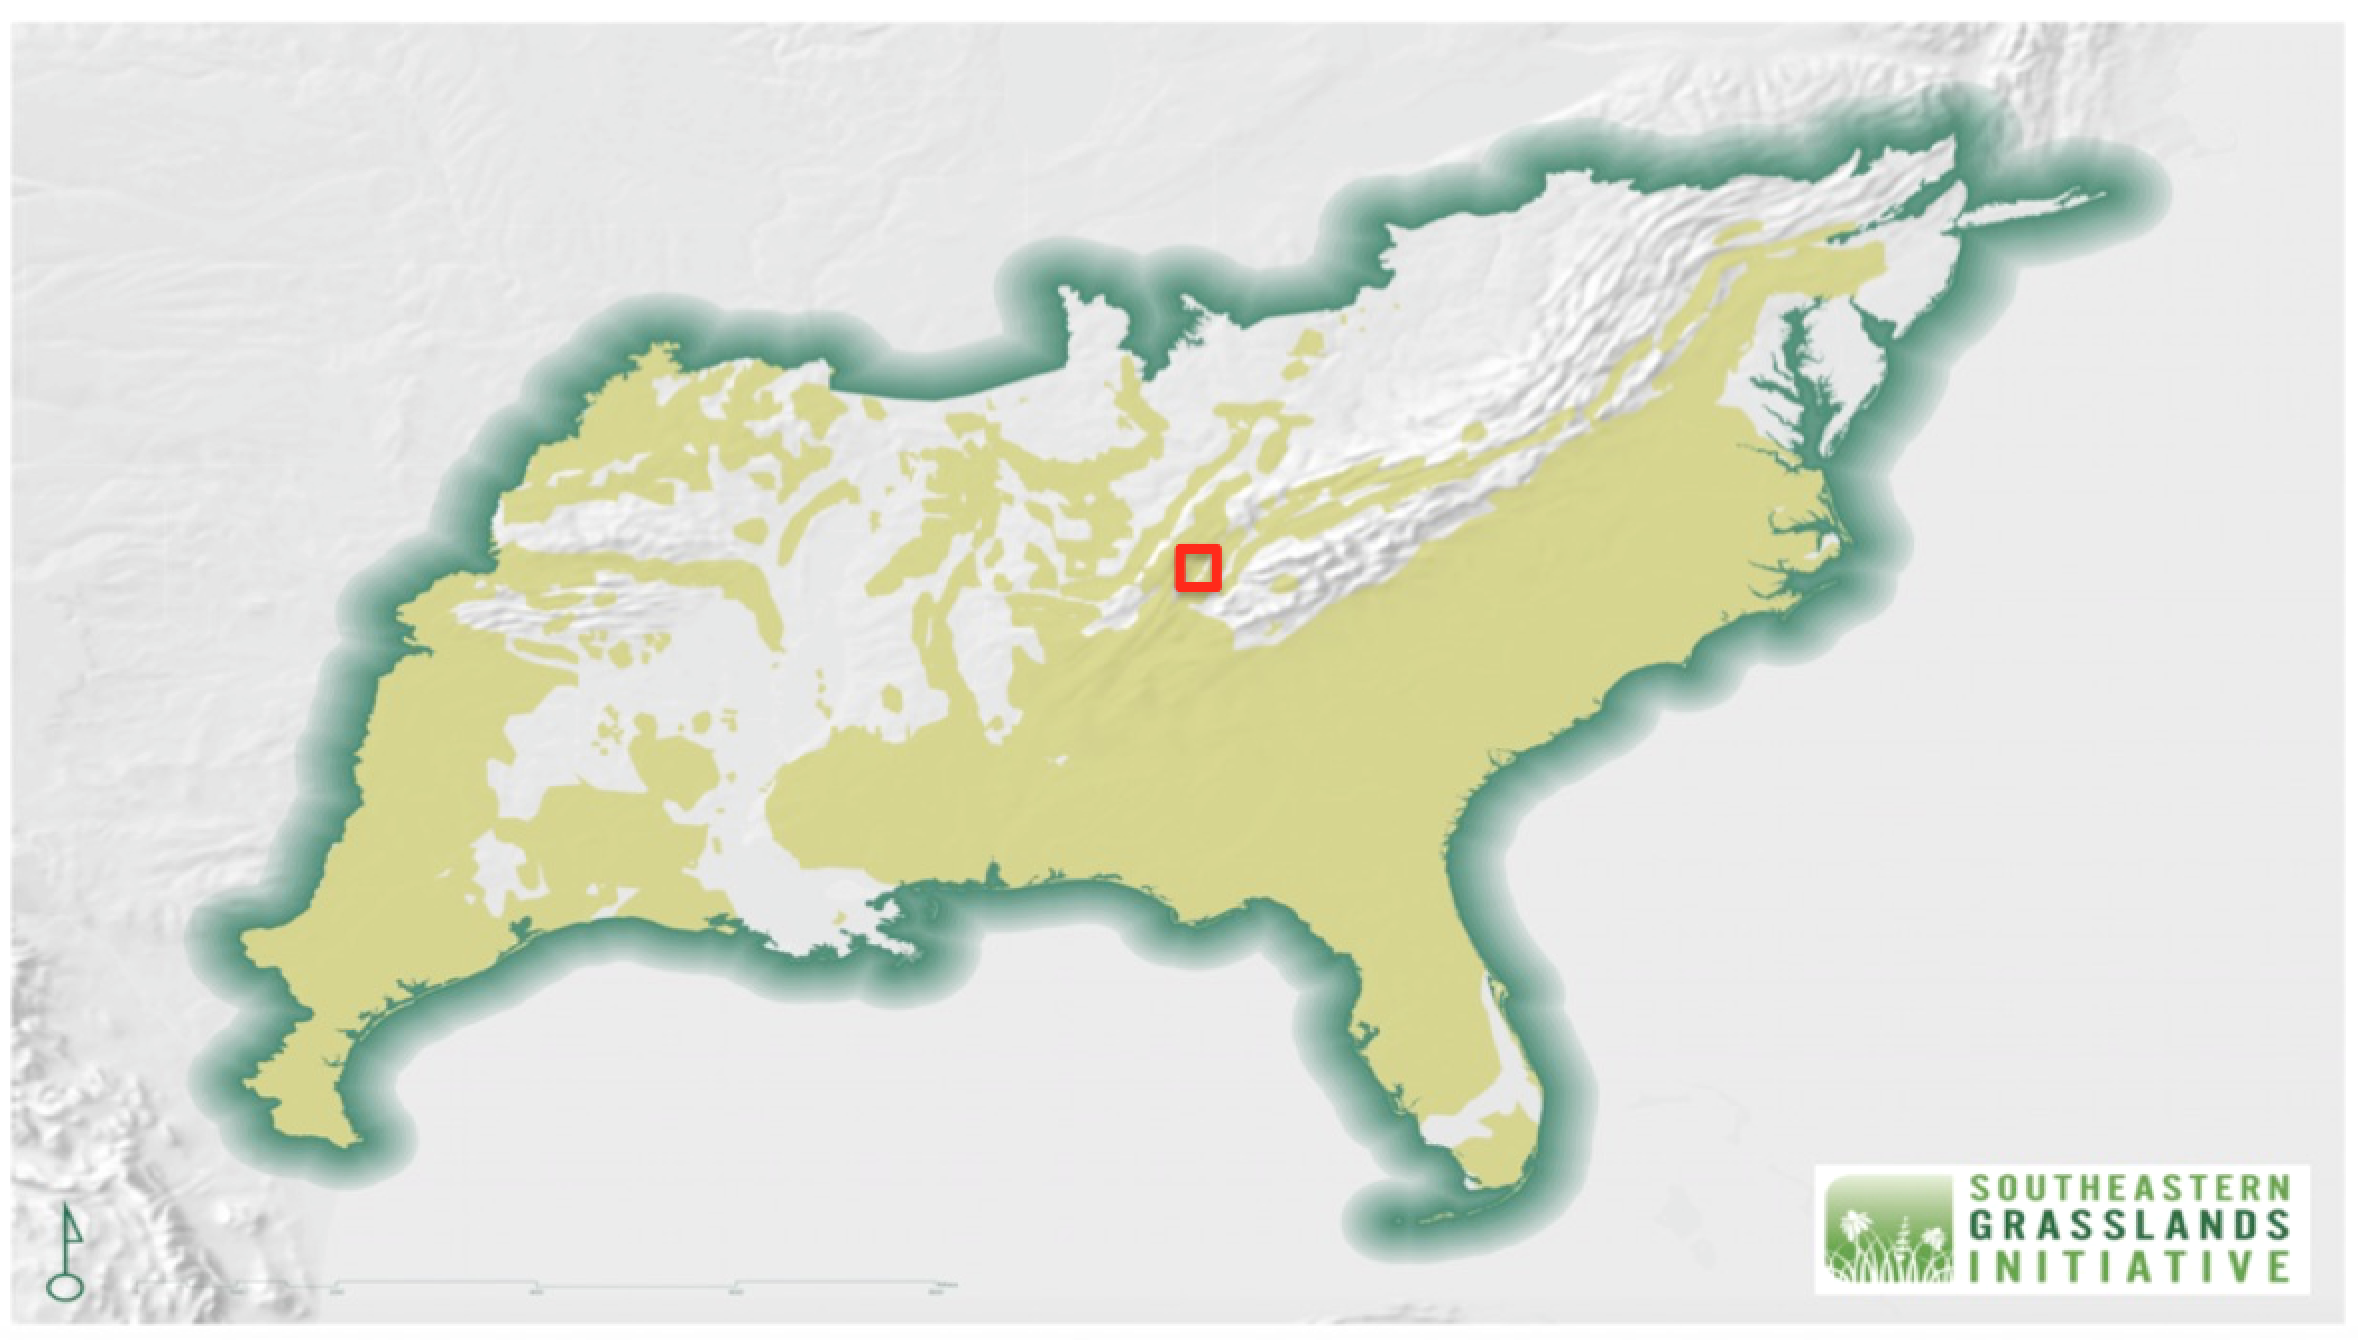
Map of Grasslandia shows estimated pre-settlement (historical) distribution of Southeastern grasslands.
Zoom in and Use Various Base Maps

Switch base maps to satellite view to zoom in on an area of interest (AOI).

Continue to zoom or refine your AOI.
Zoom in Farther to See Already Mapped Examples of Modern Grasslands


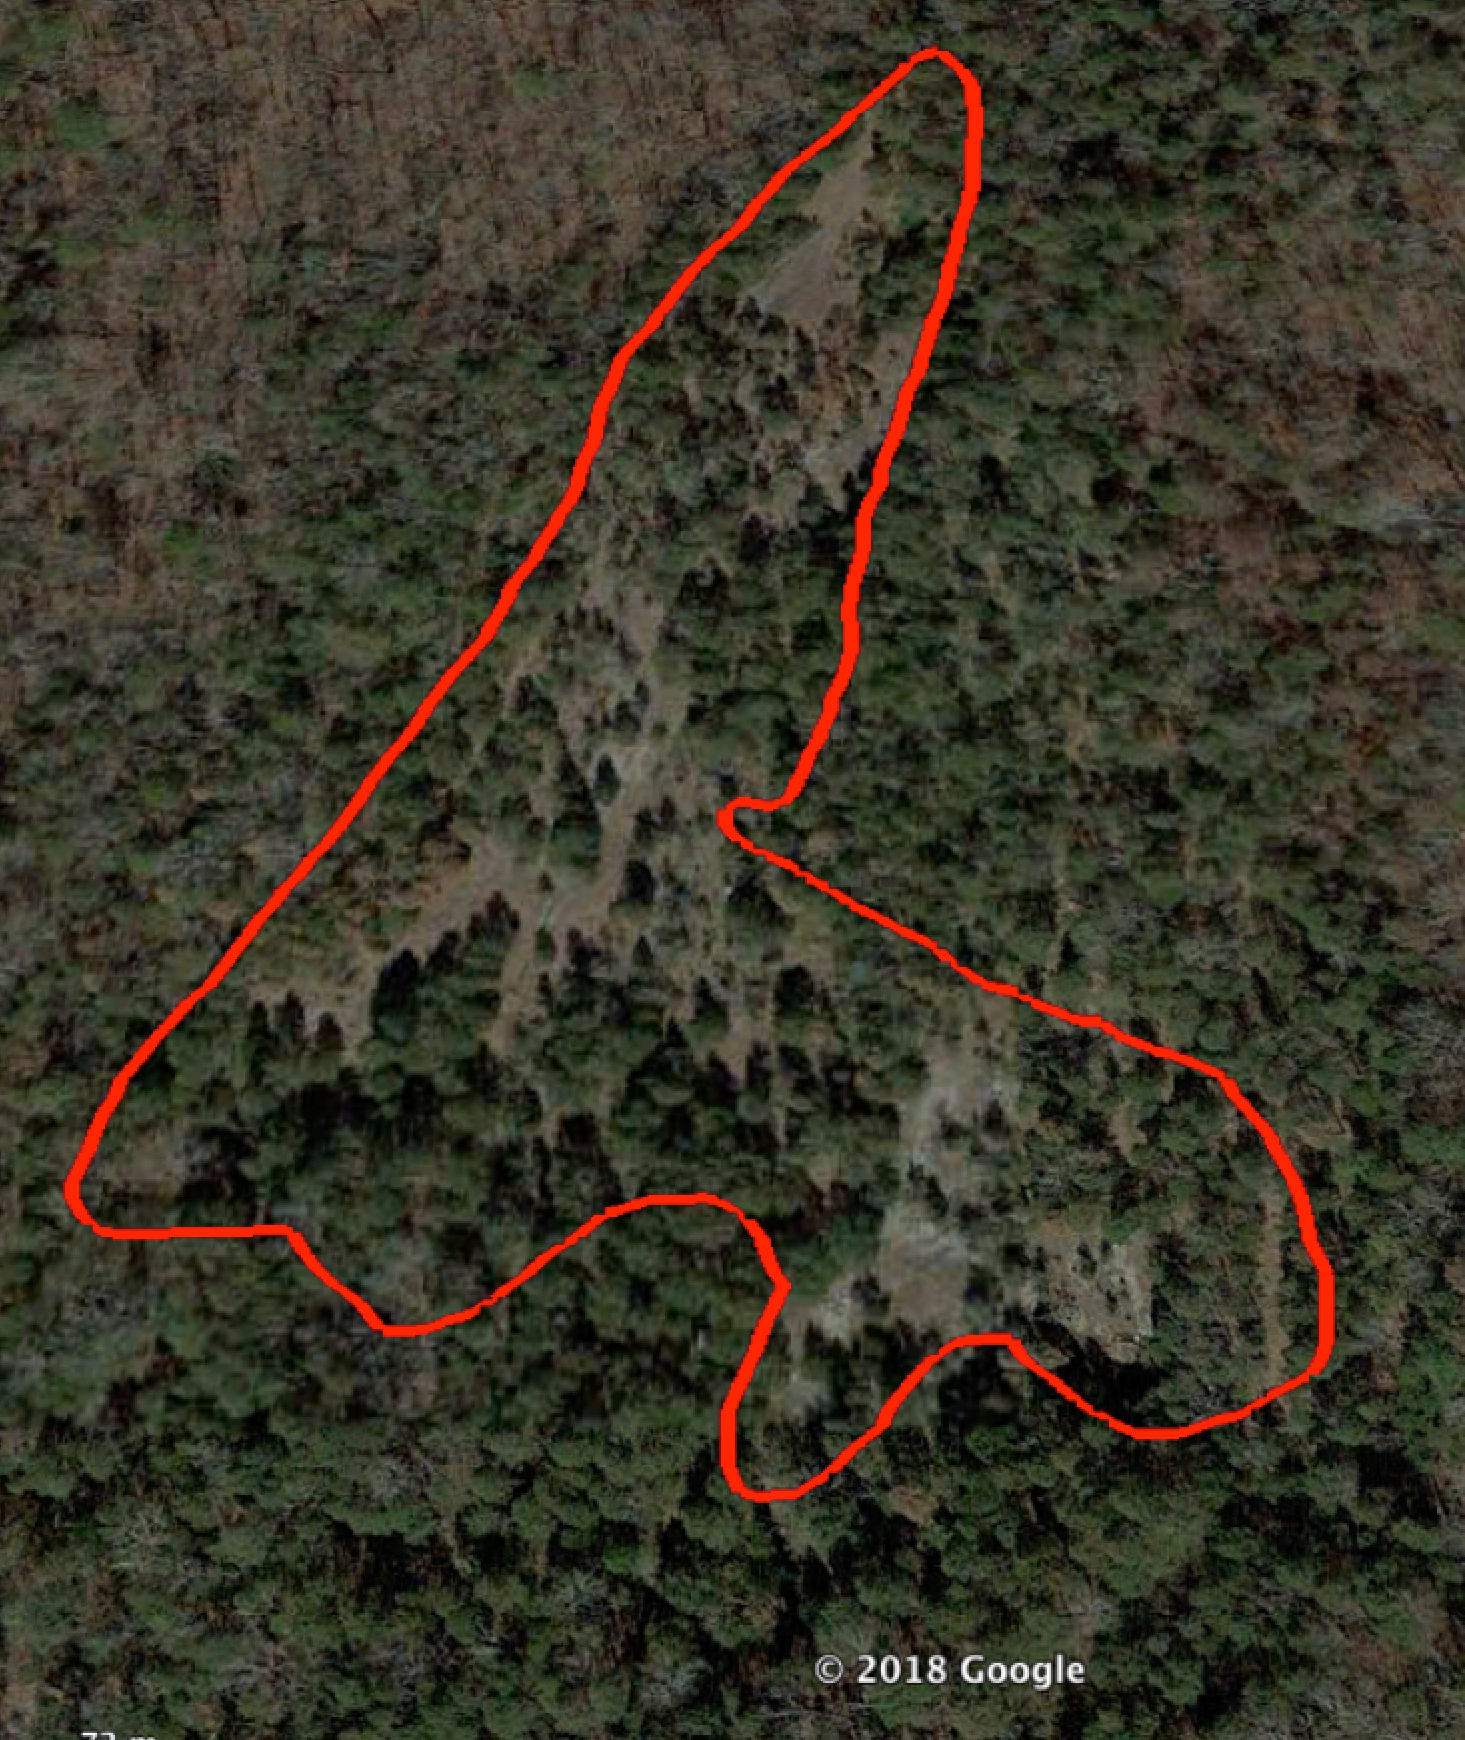
"Drop in" any point in Grasslandia to view the pre-settlement landscape (developed using a combination of vegetation modeling, artist reconstructions, and animation).
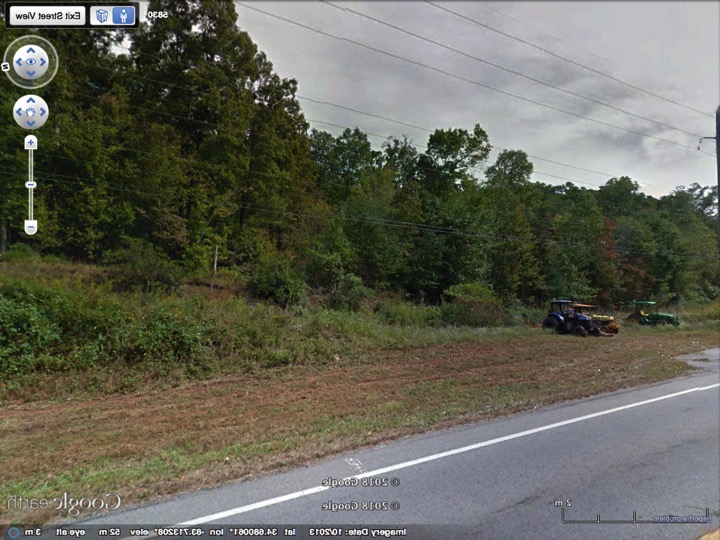
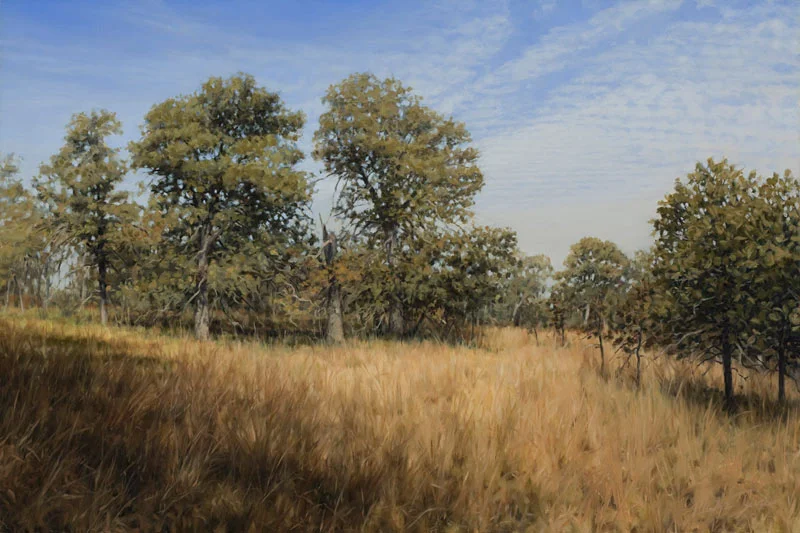
The Google Earth Street View image on left shows modern site. At right, artist reconstruction (painting by Philip Juras, www.philipjuras.com), shows what the site might have looked like in 1775.

Vegetation models would help to inform reconstructions like that shown in the artist rendering above.
Icons Emerge that Show Evidence of Grasslands - These are "Anchor Points"

NatureServe's Butterfly Icon = Rare Species Records; NVC Tree Icon = Vegetation Plots; Panoramio Symbol = Photos; iNaturalist Icon = iNaturalist record; "x" symbol = historical quote; Checklist icon = Site Notes and Species Checklists
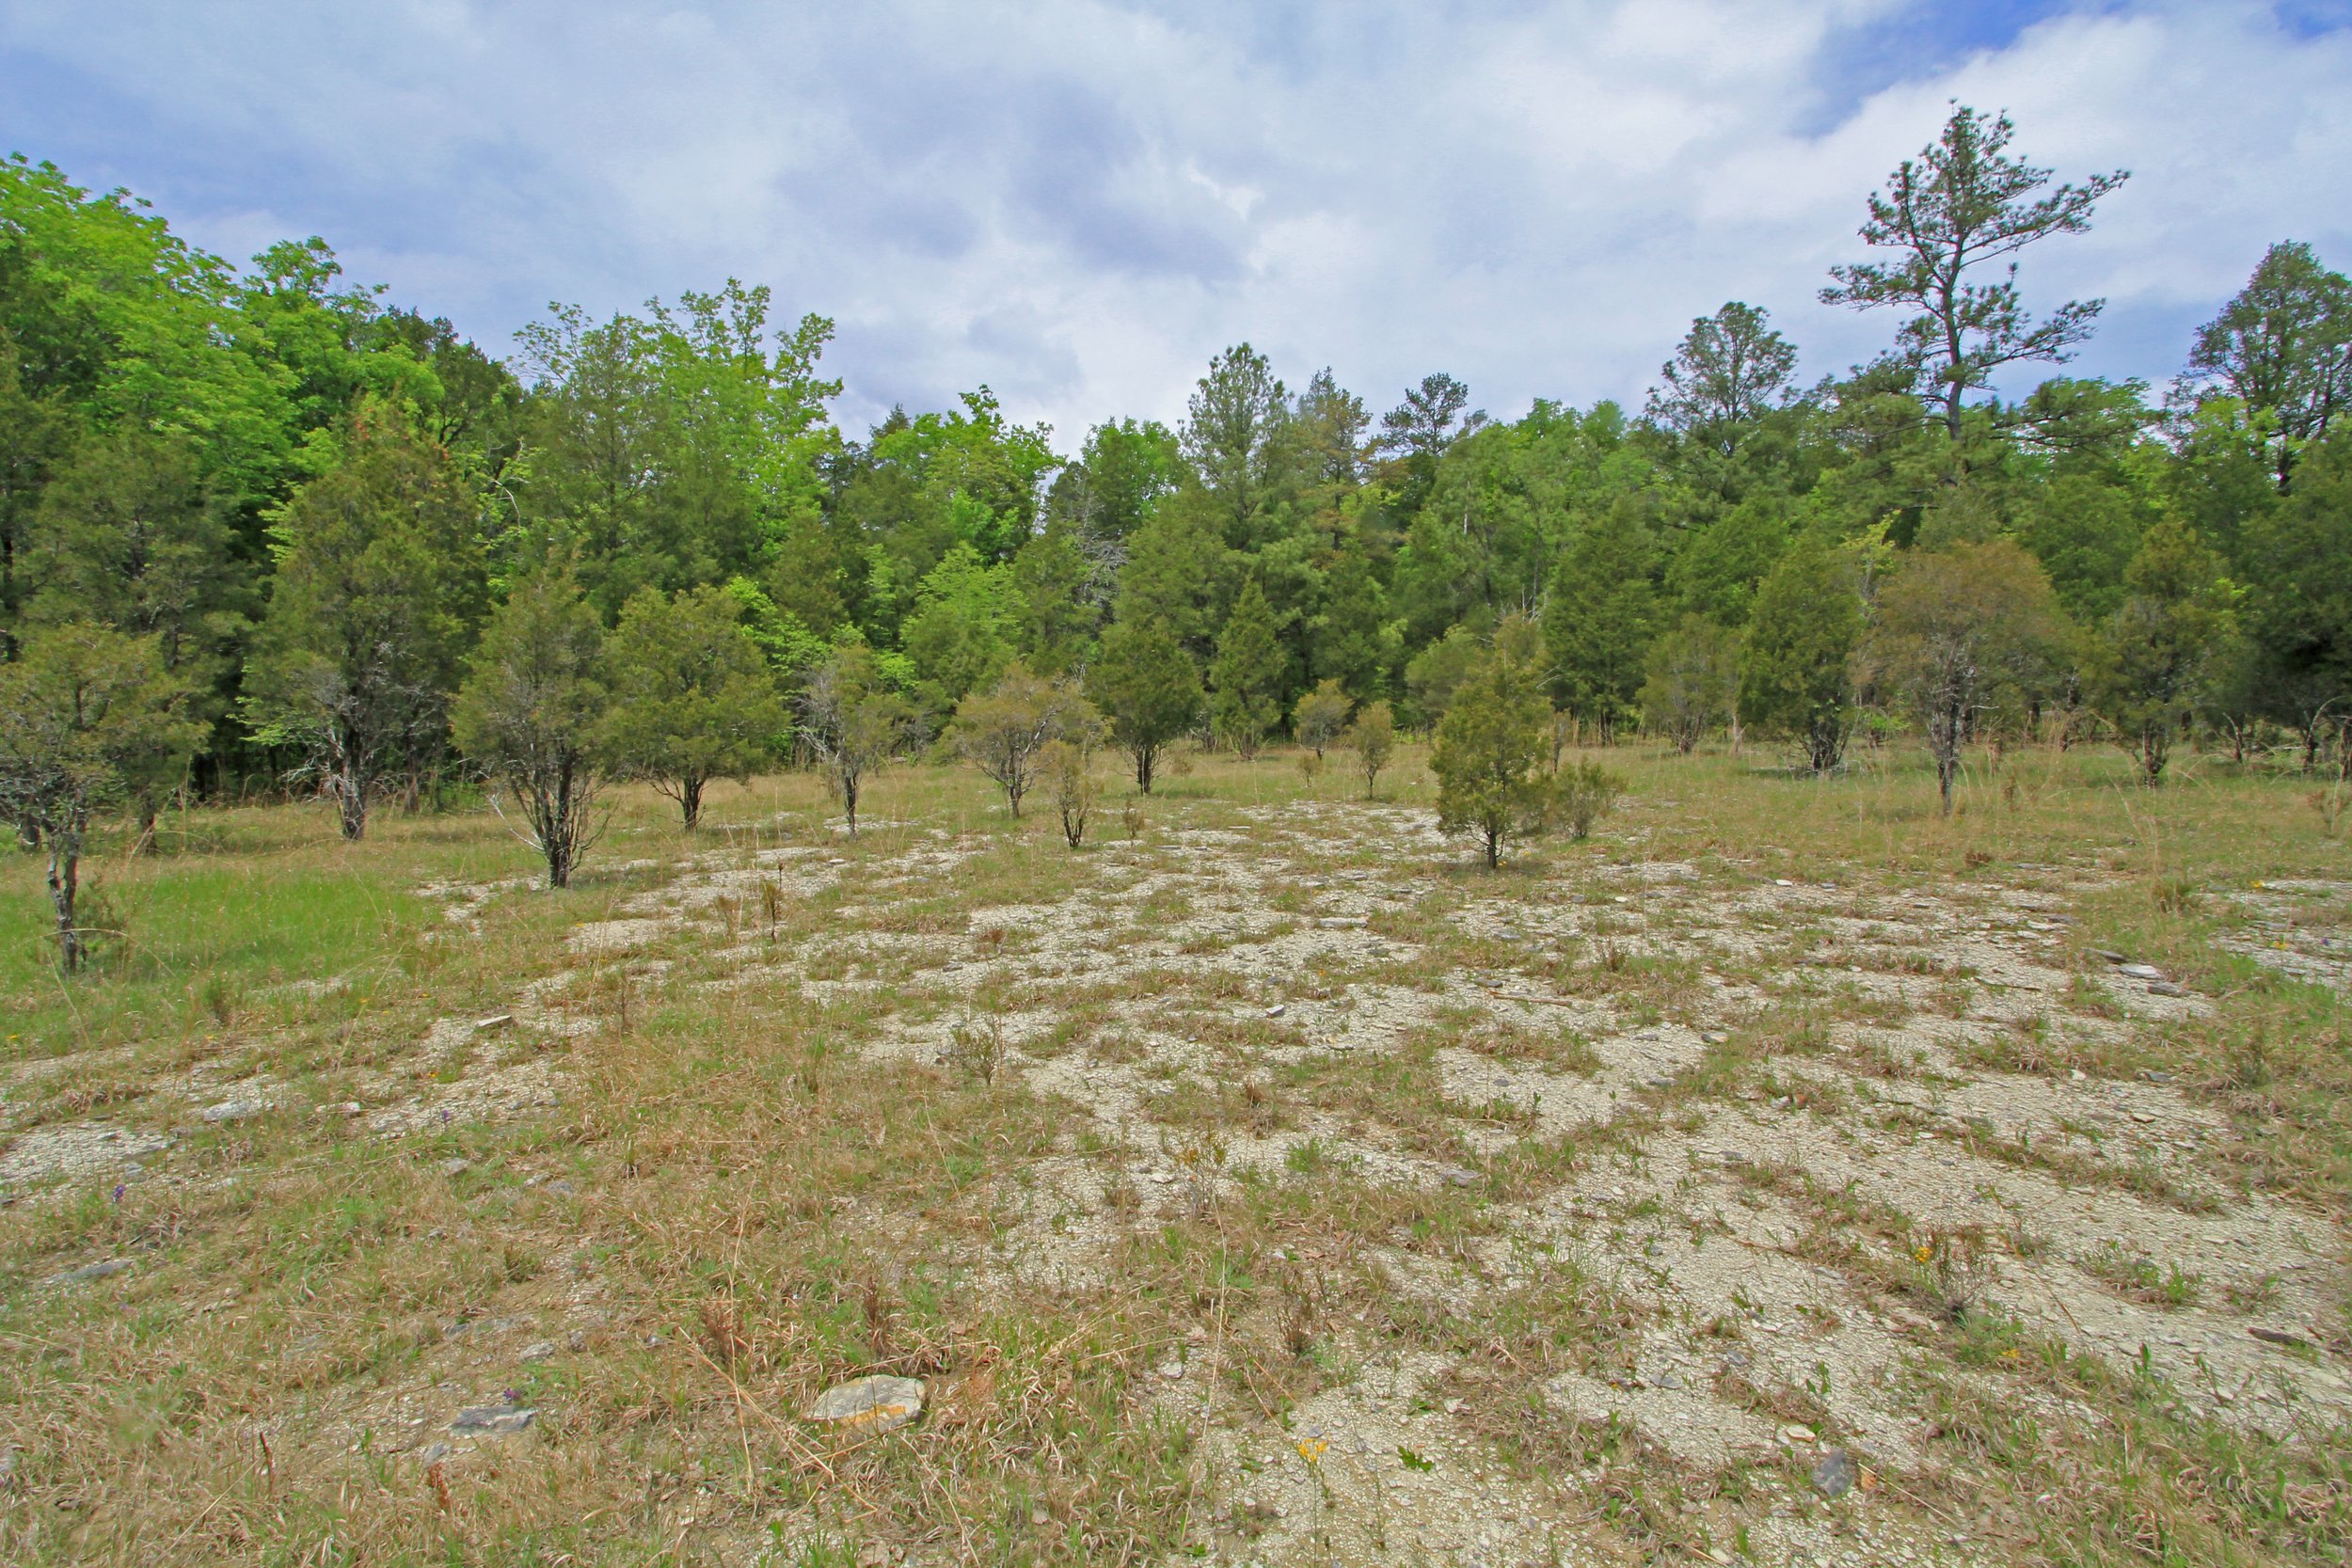
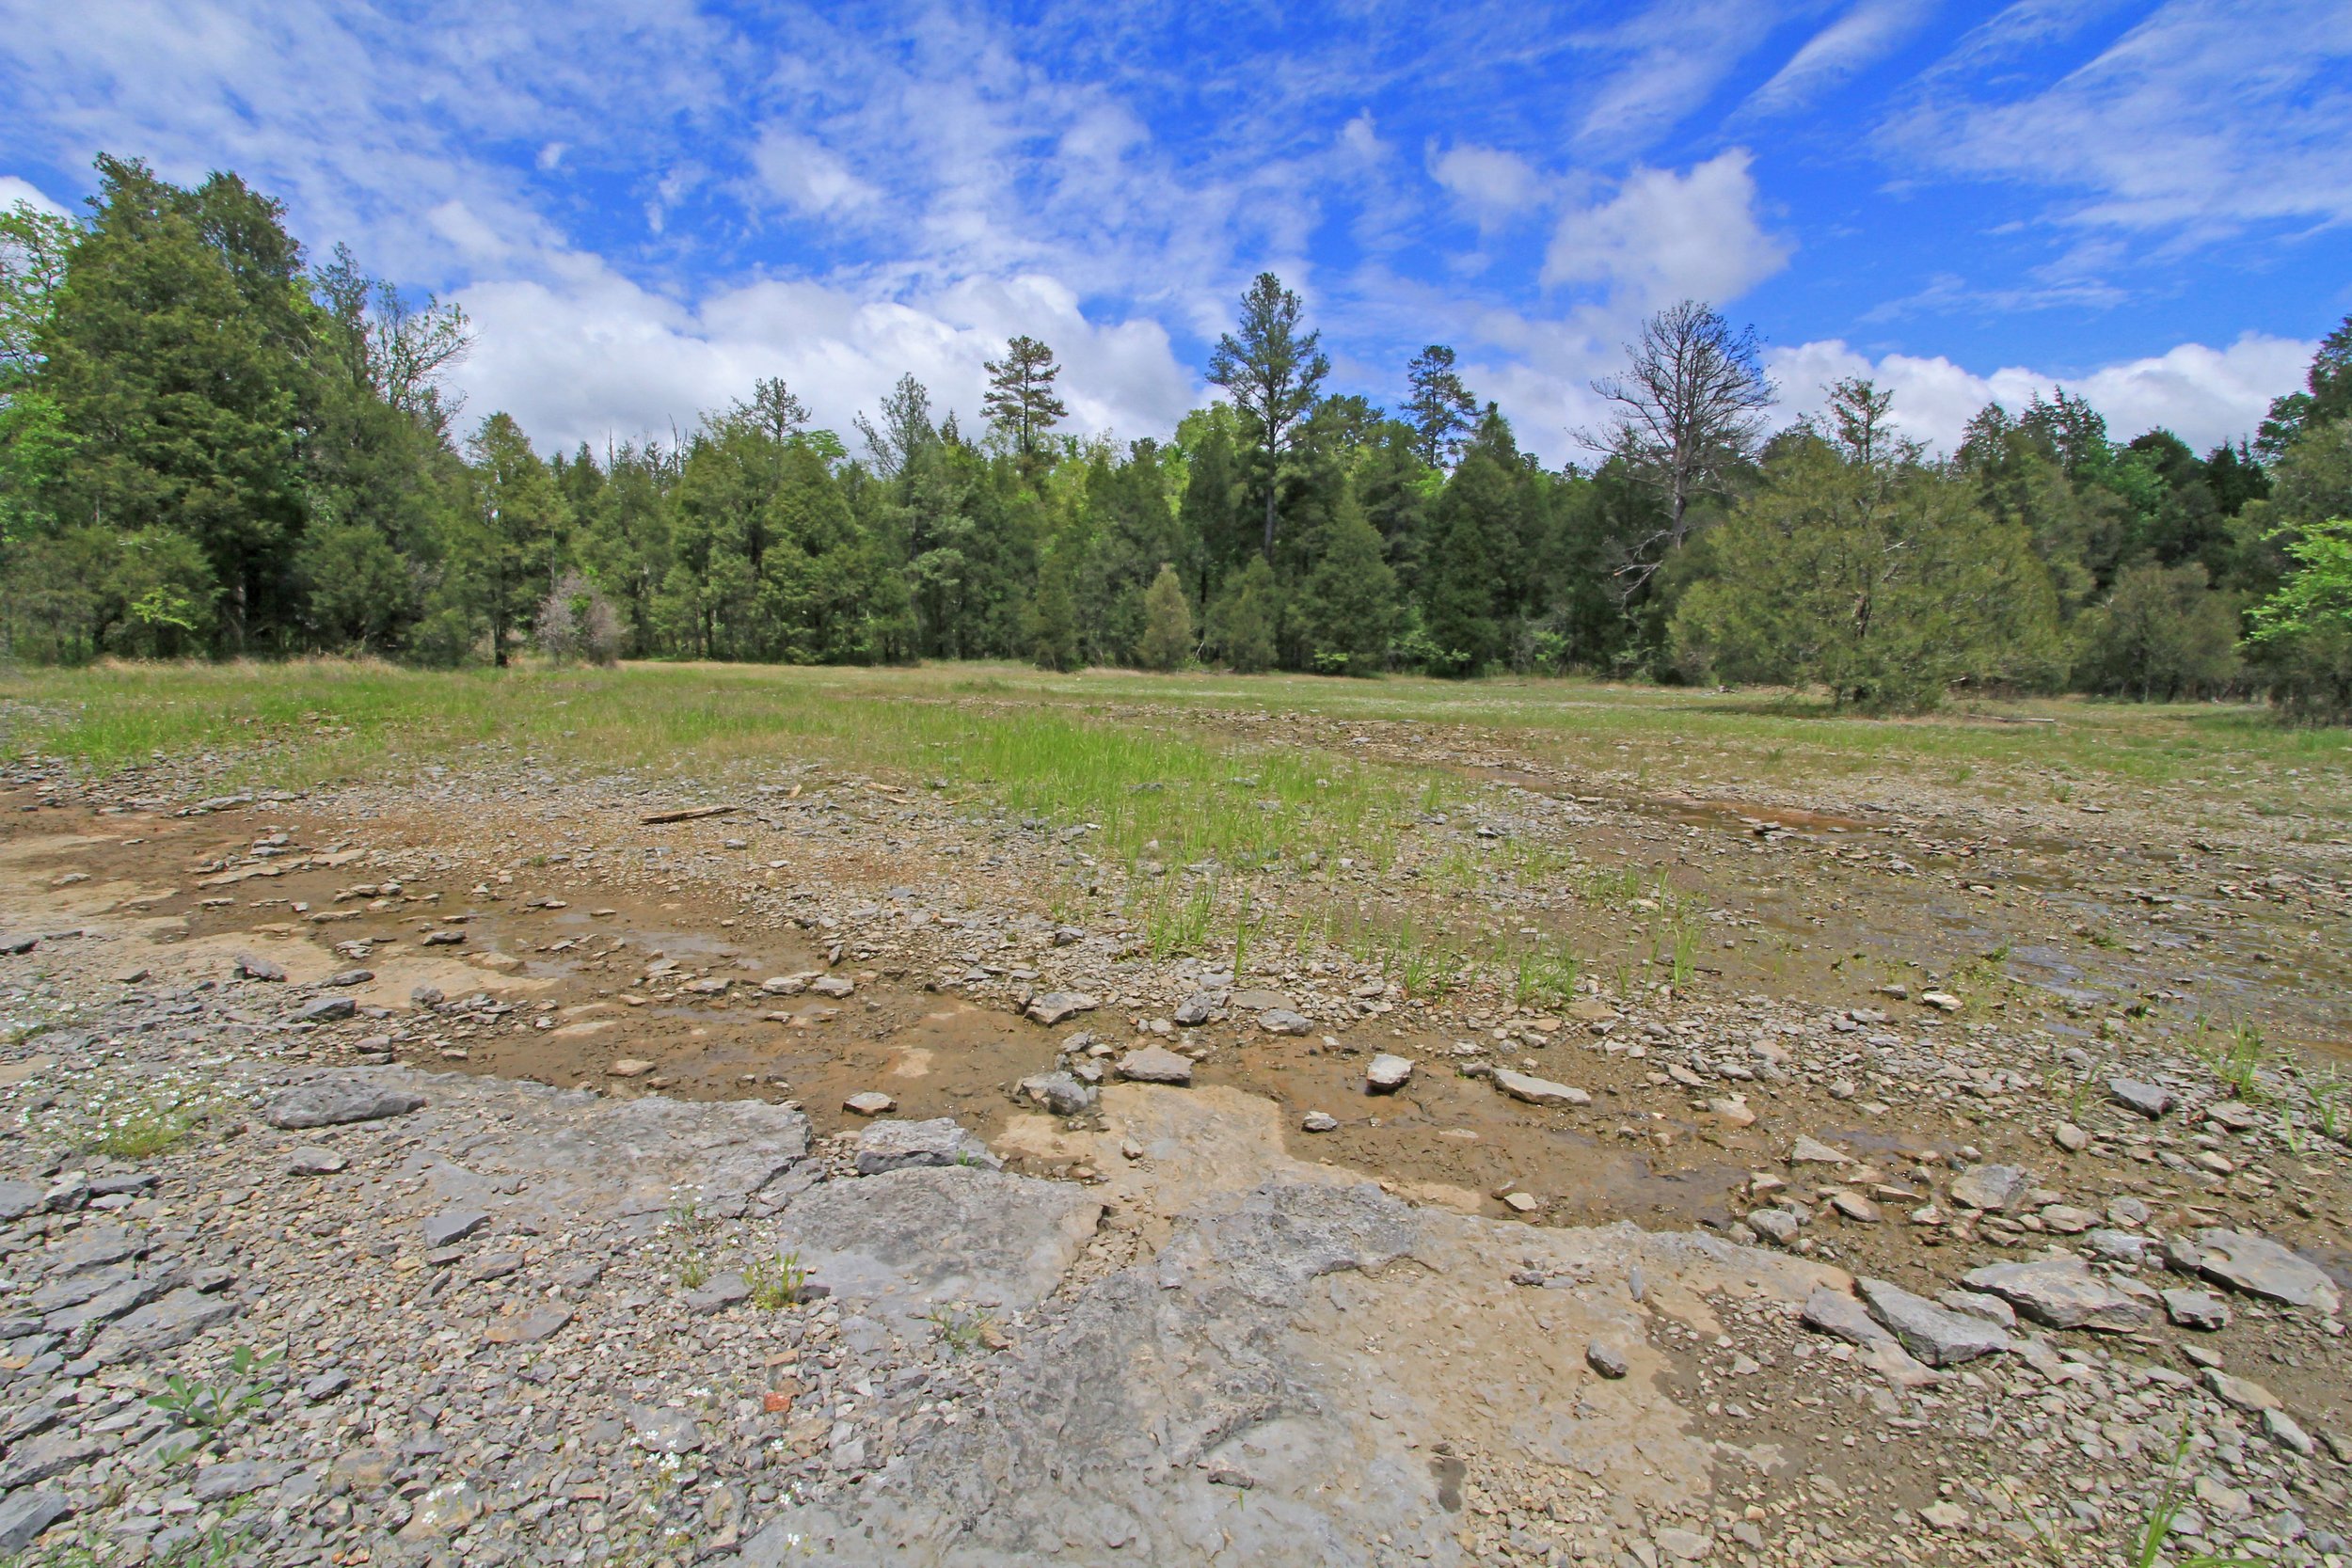
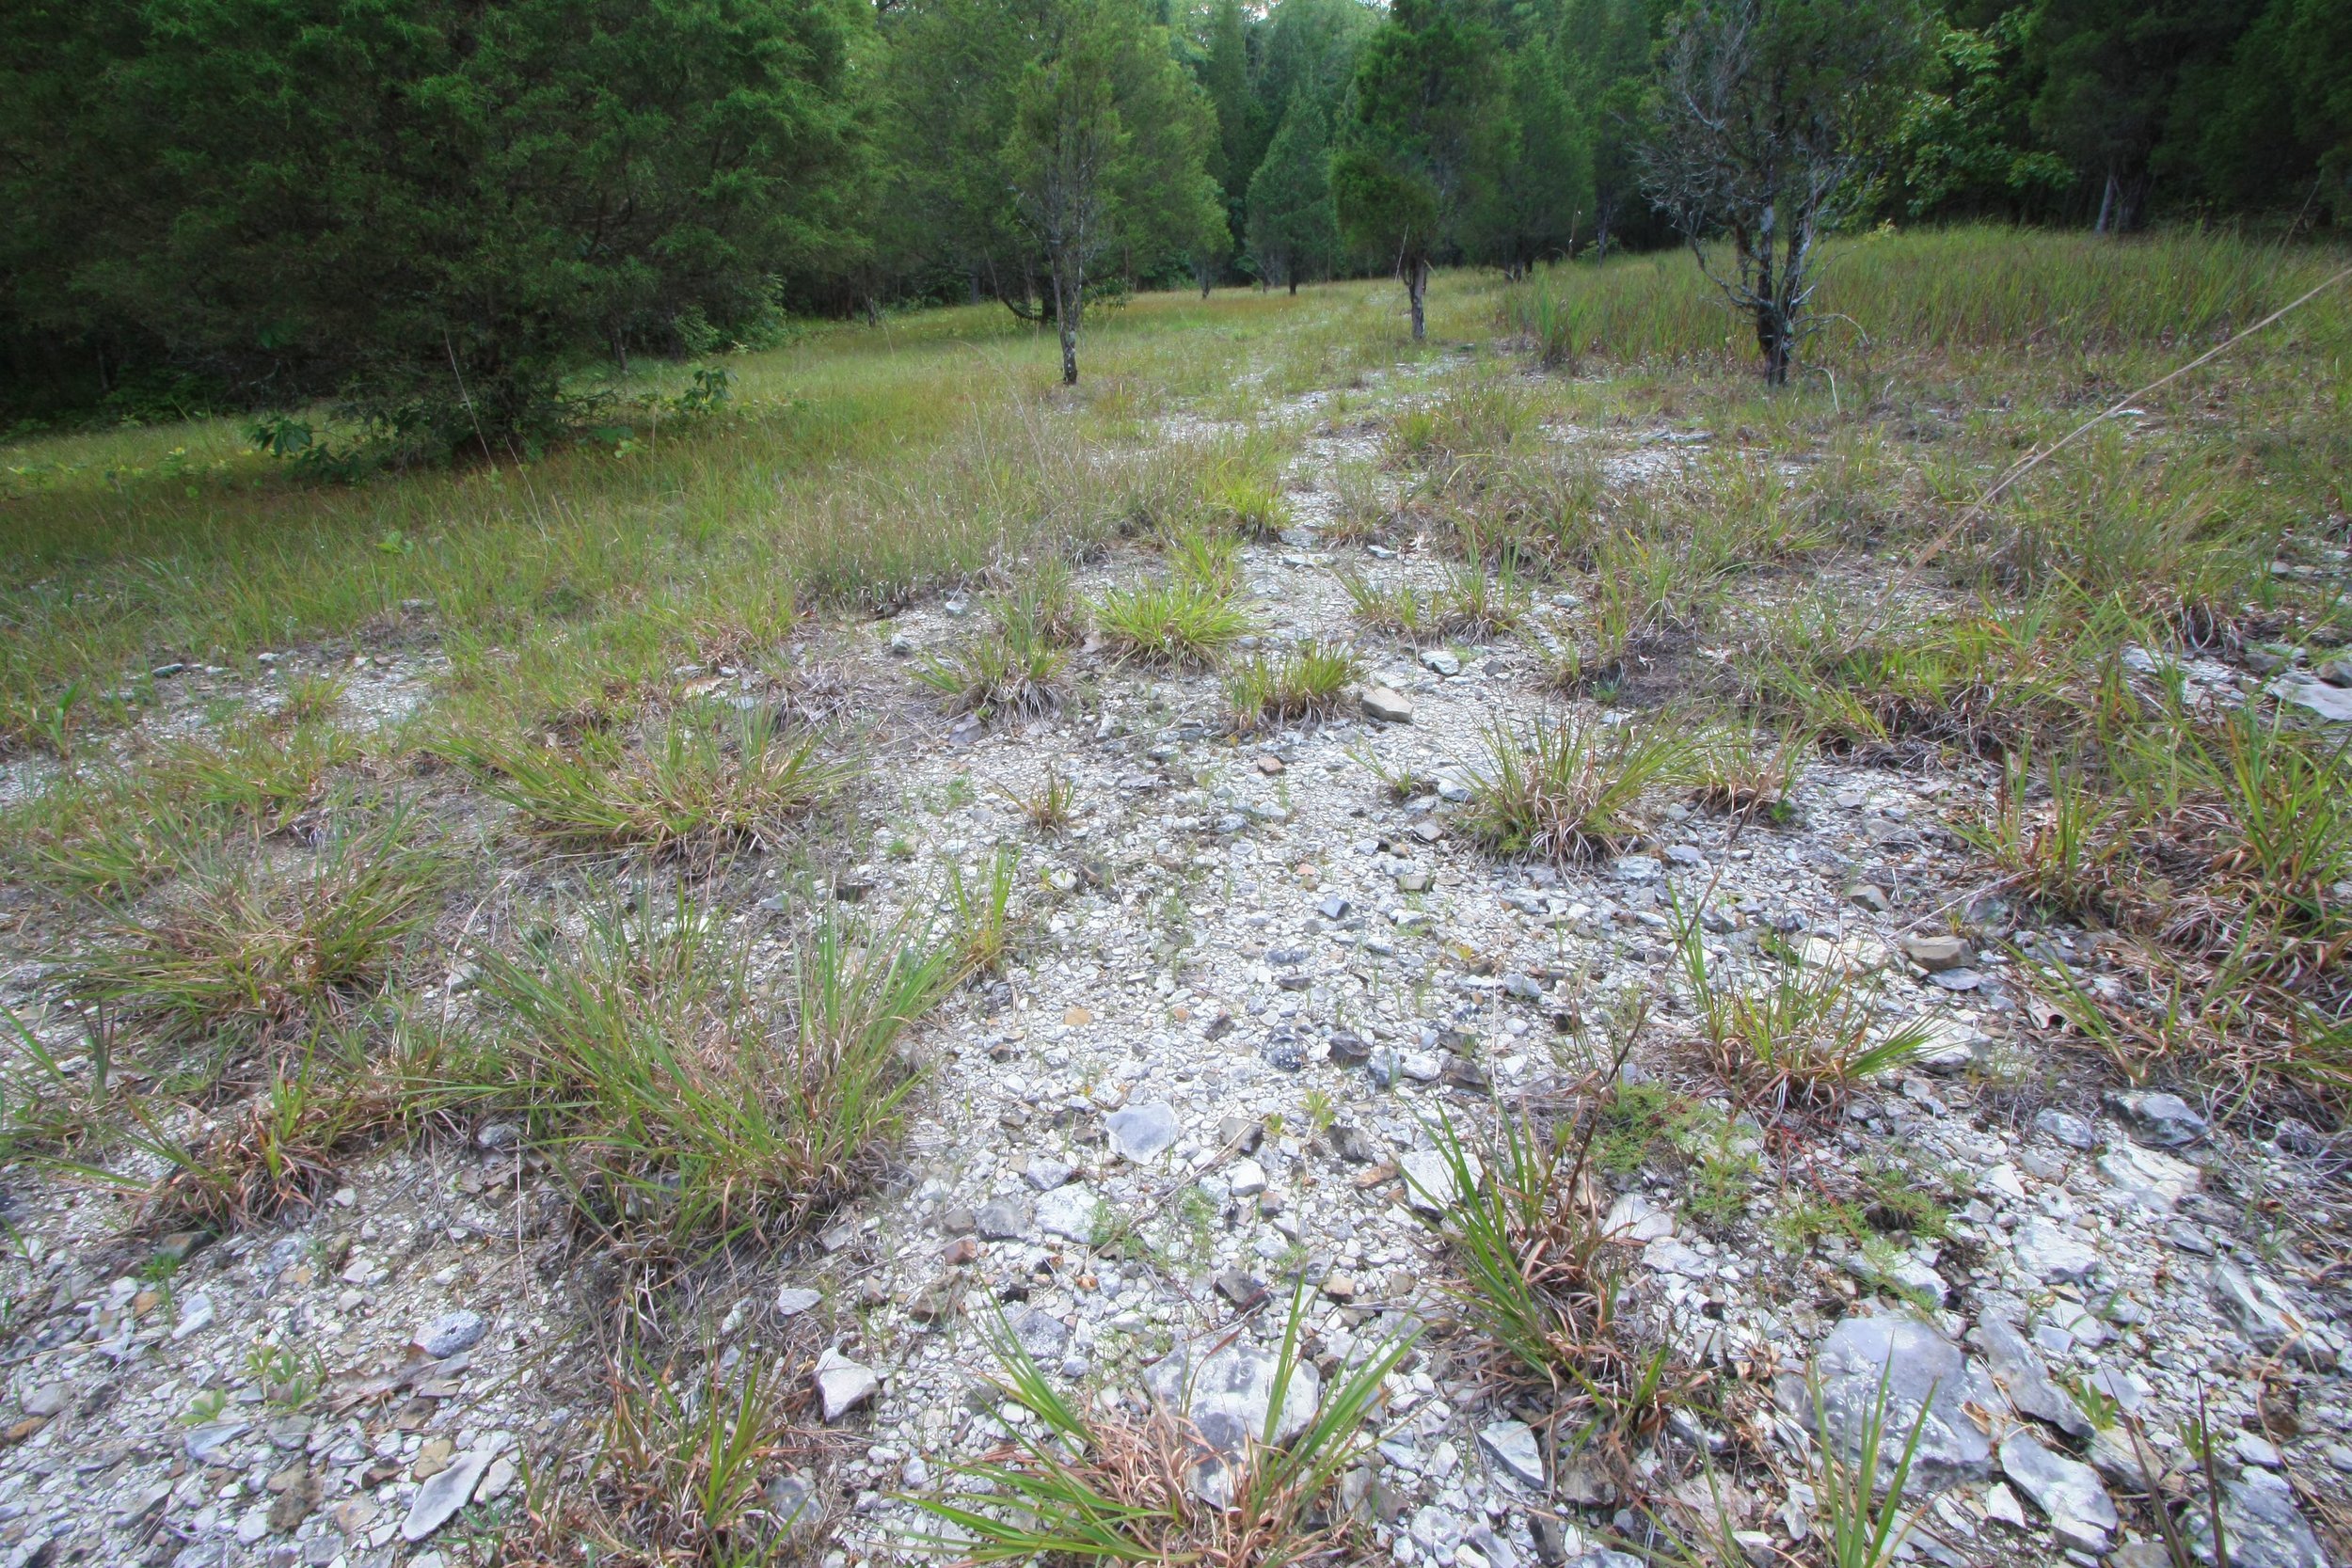
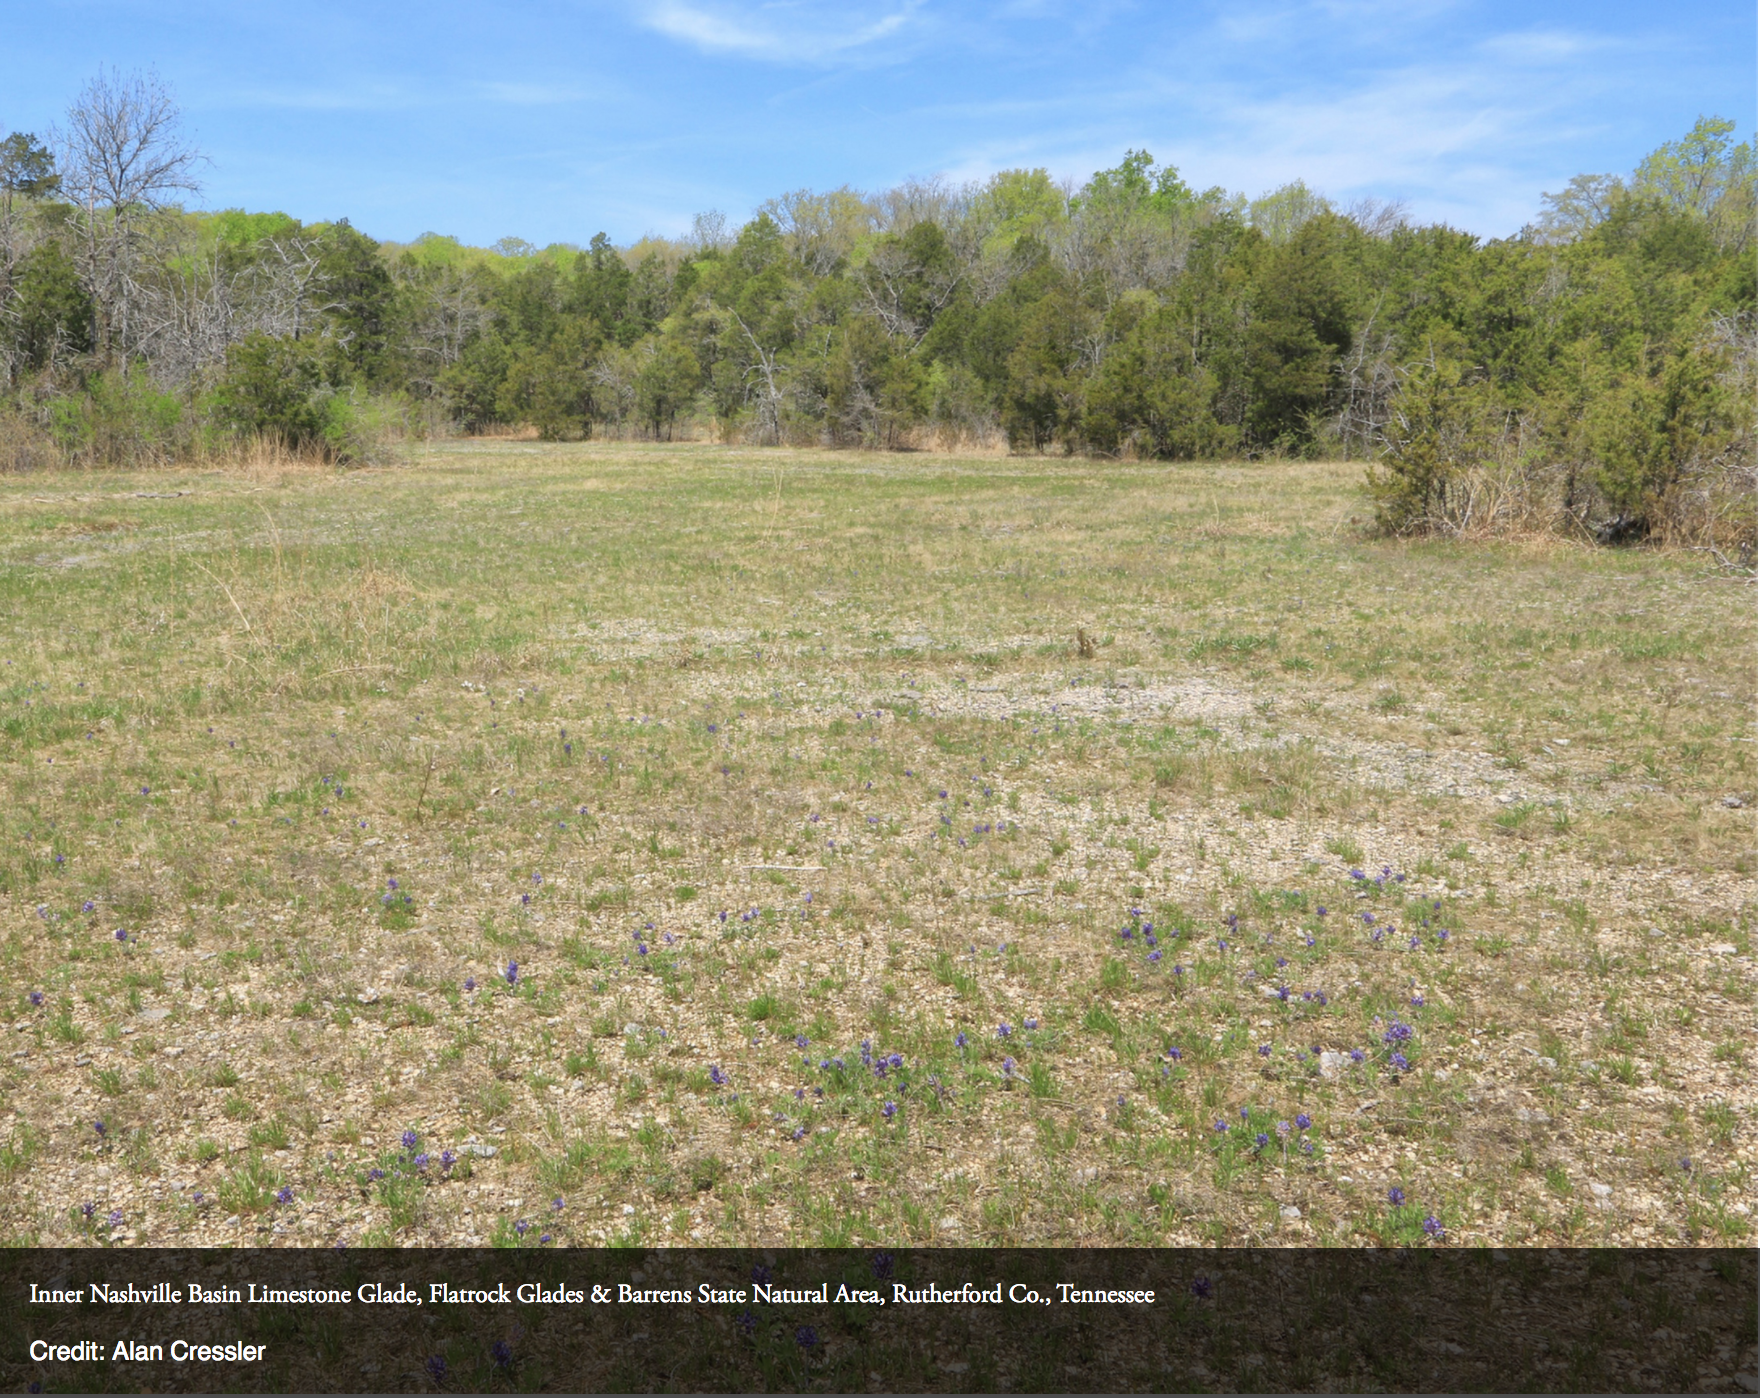
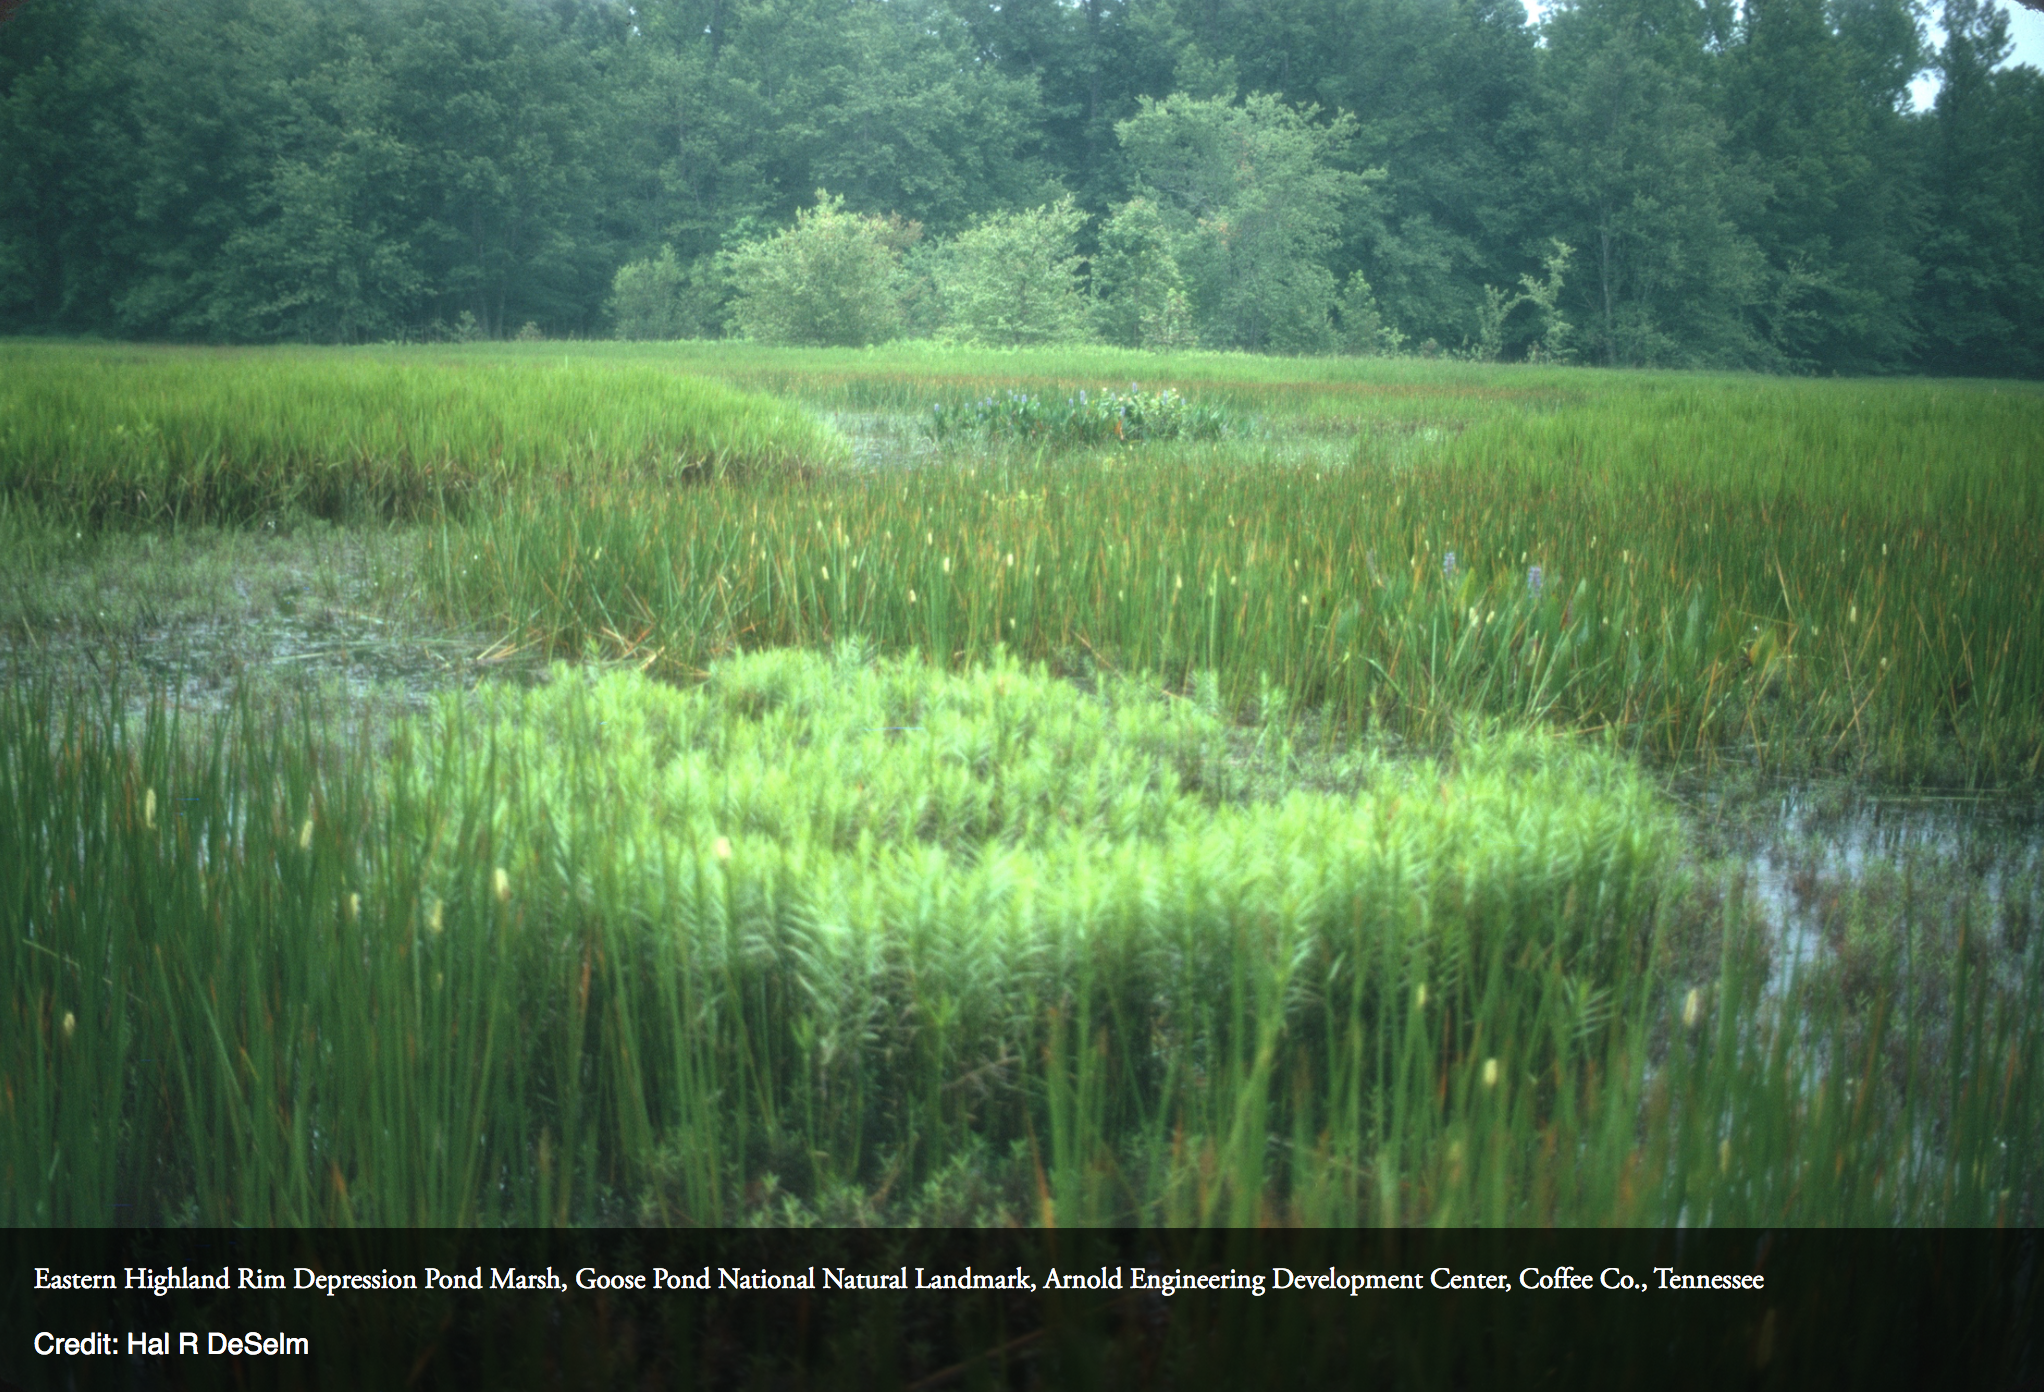
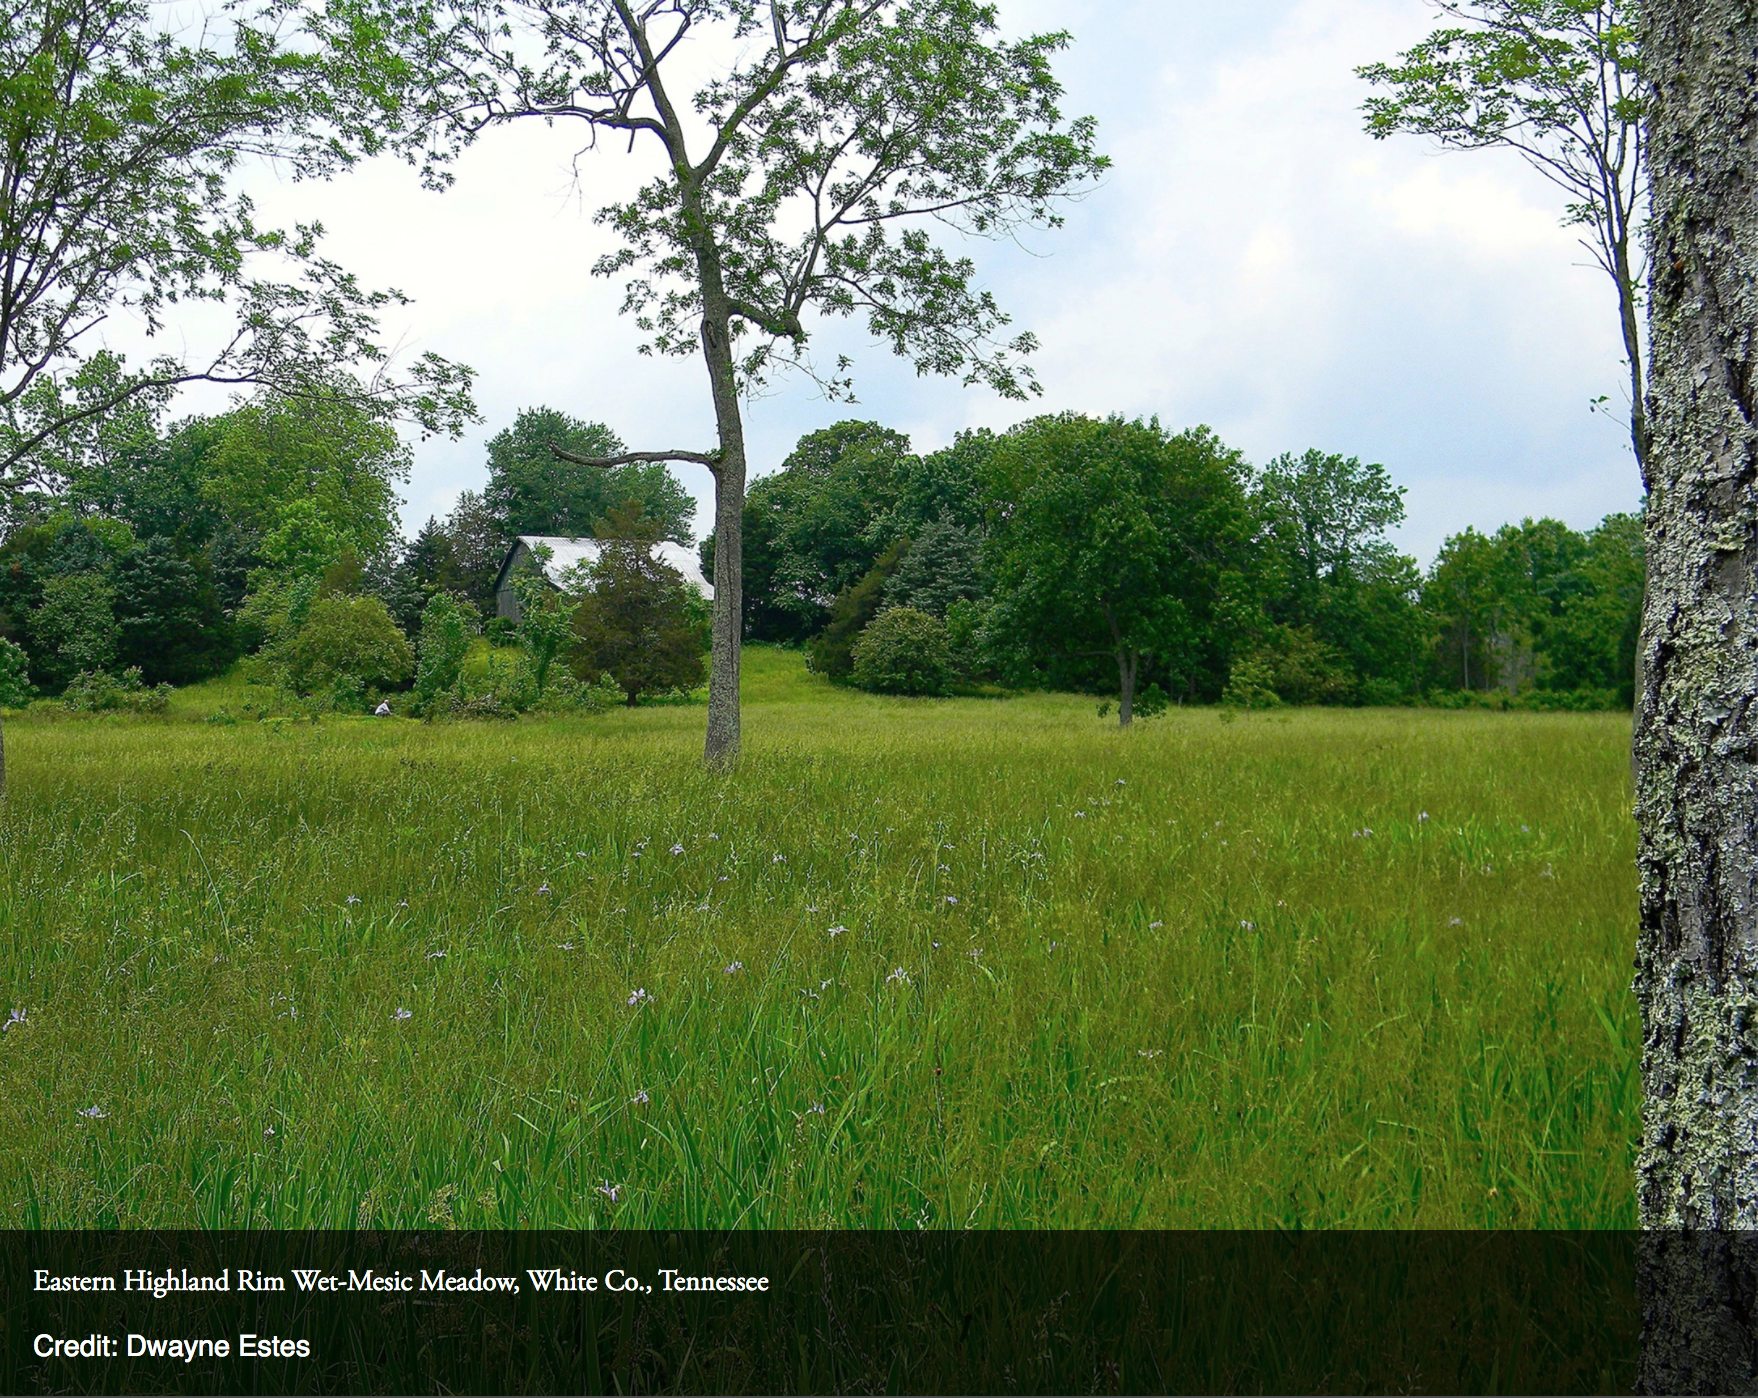
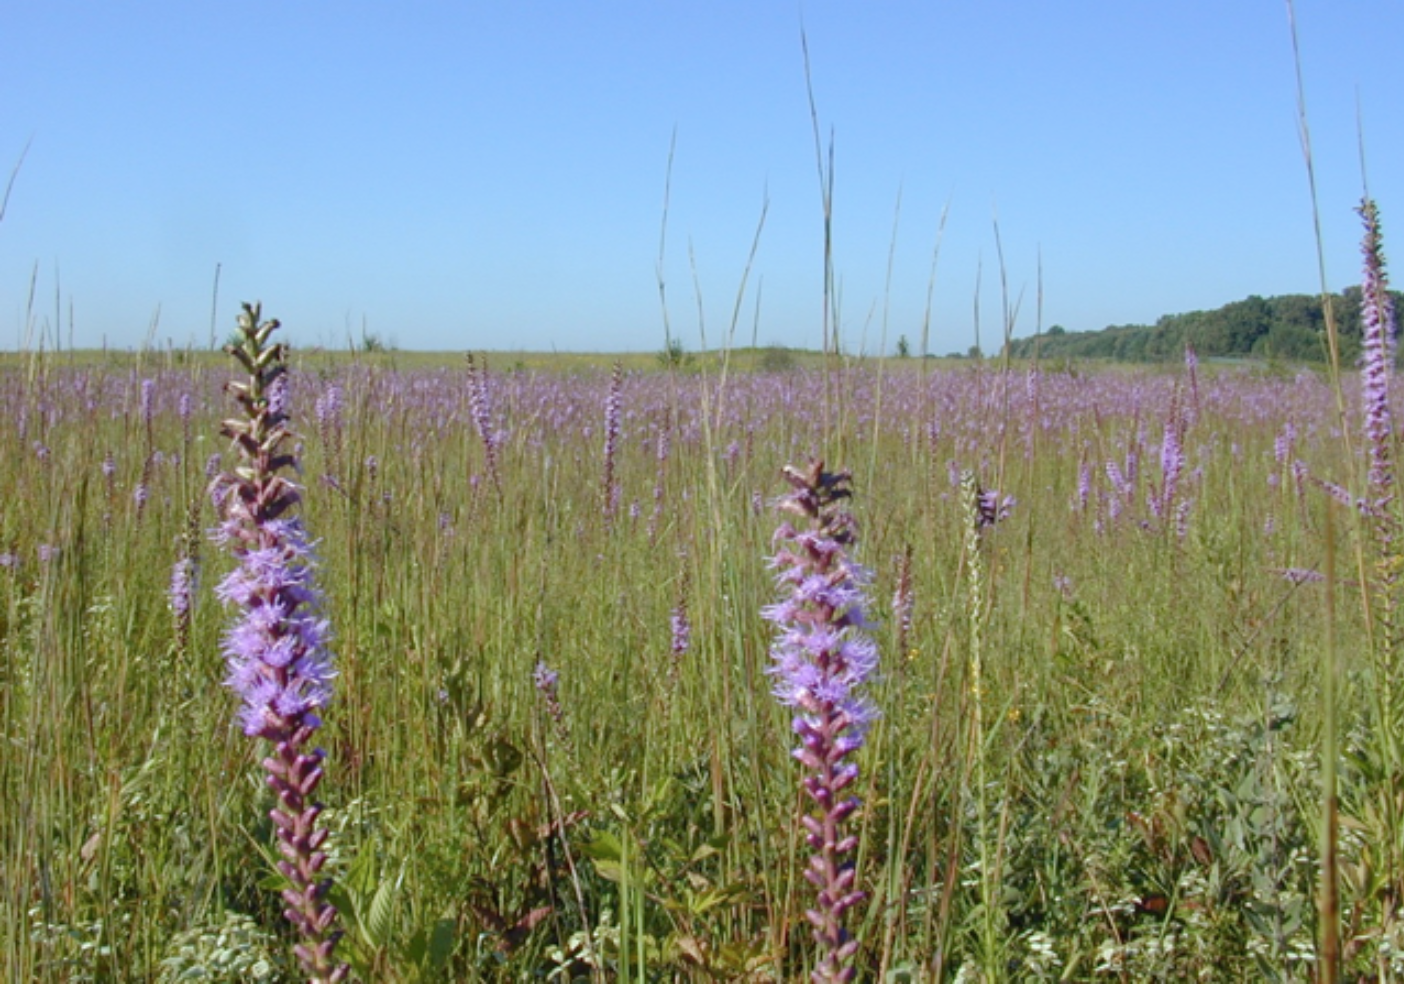
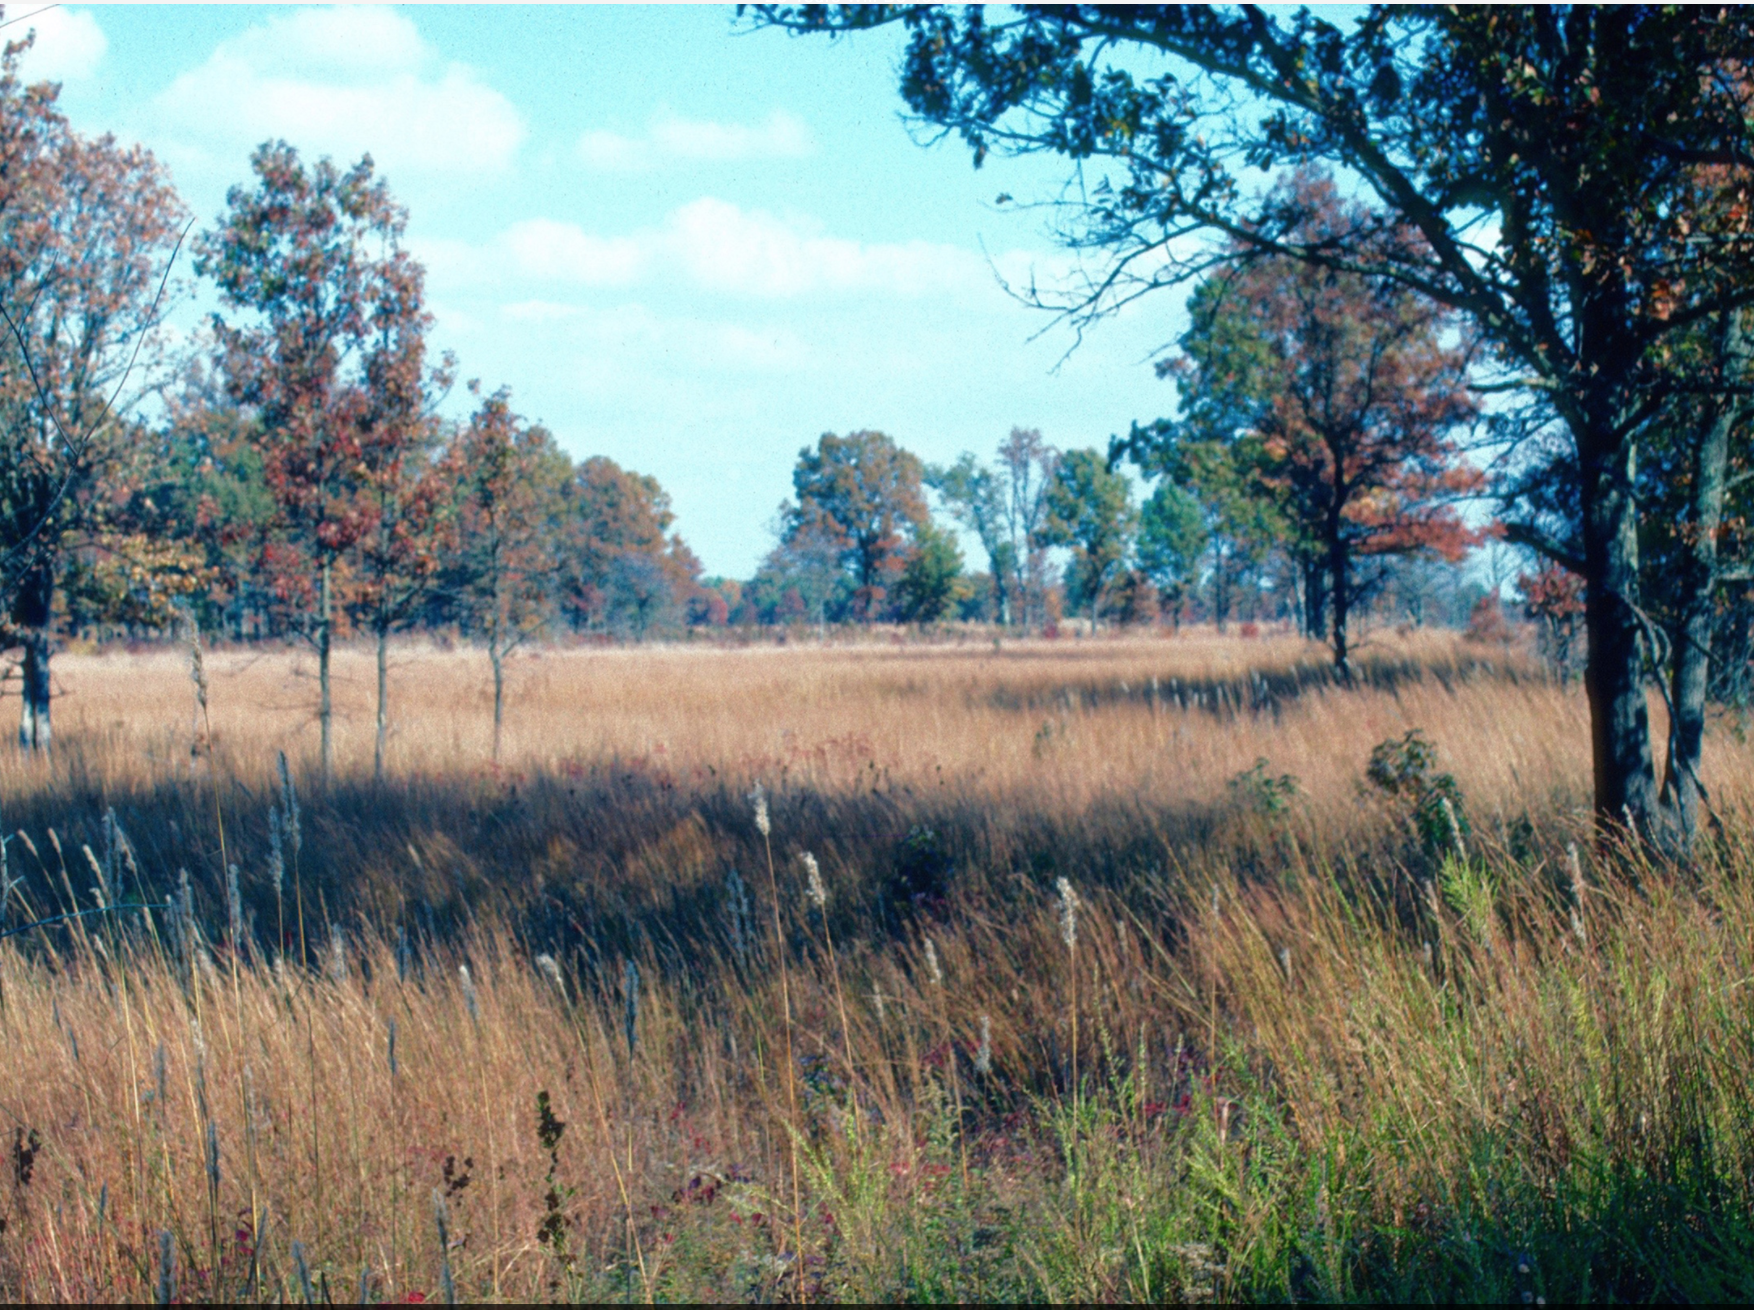
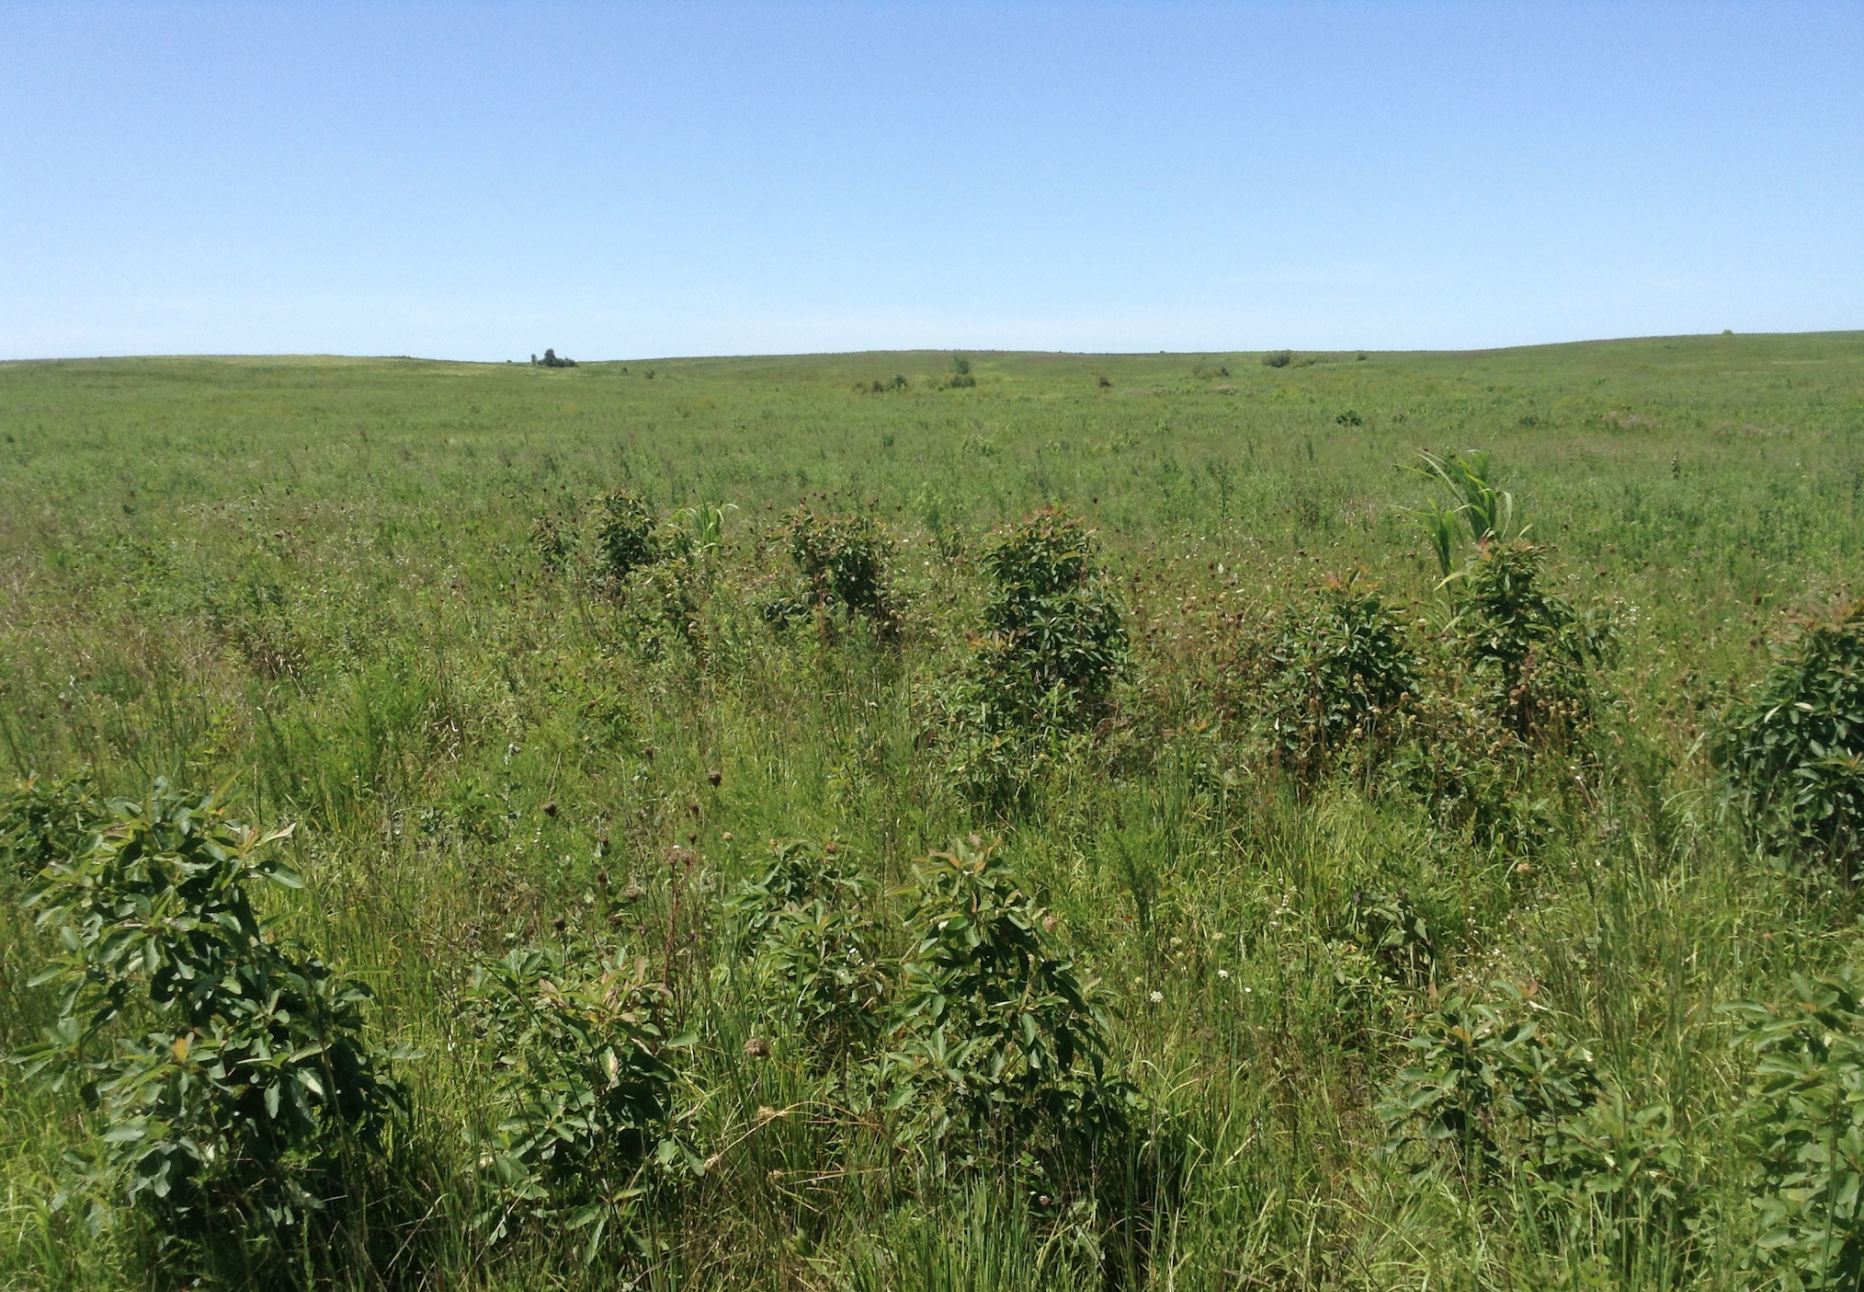
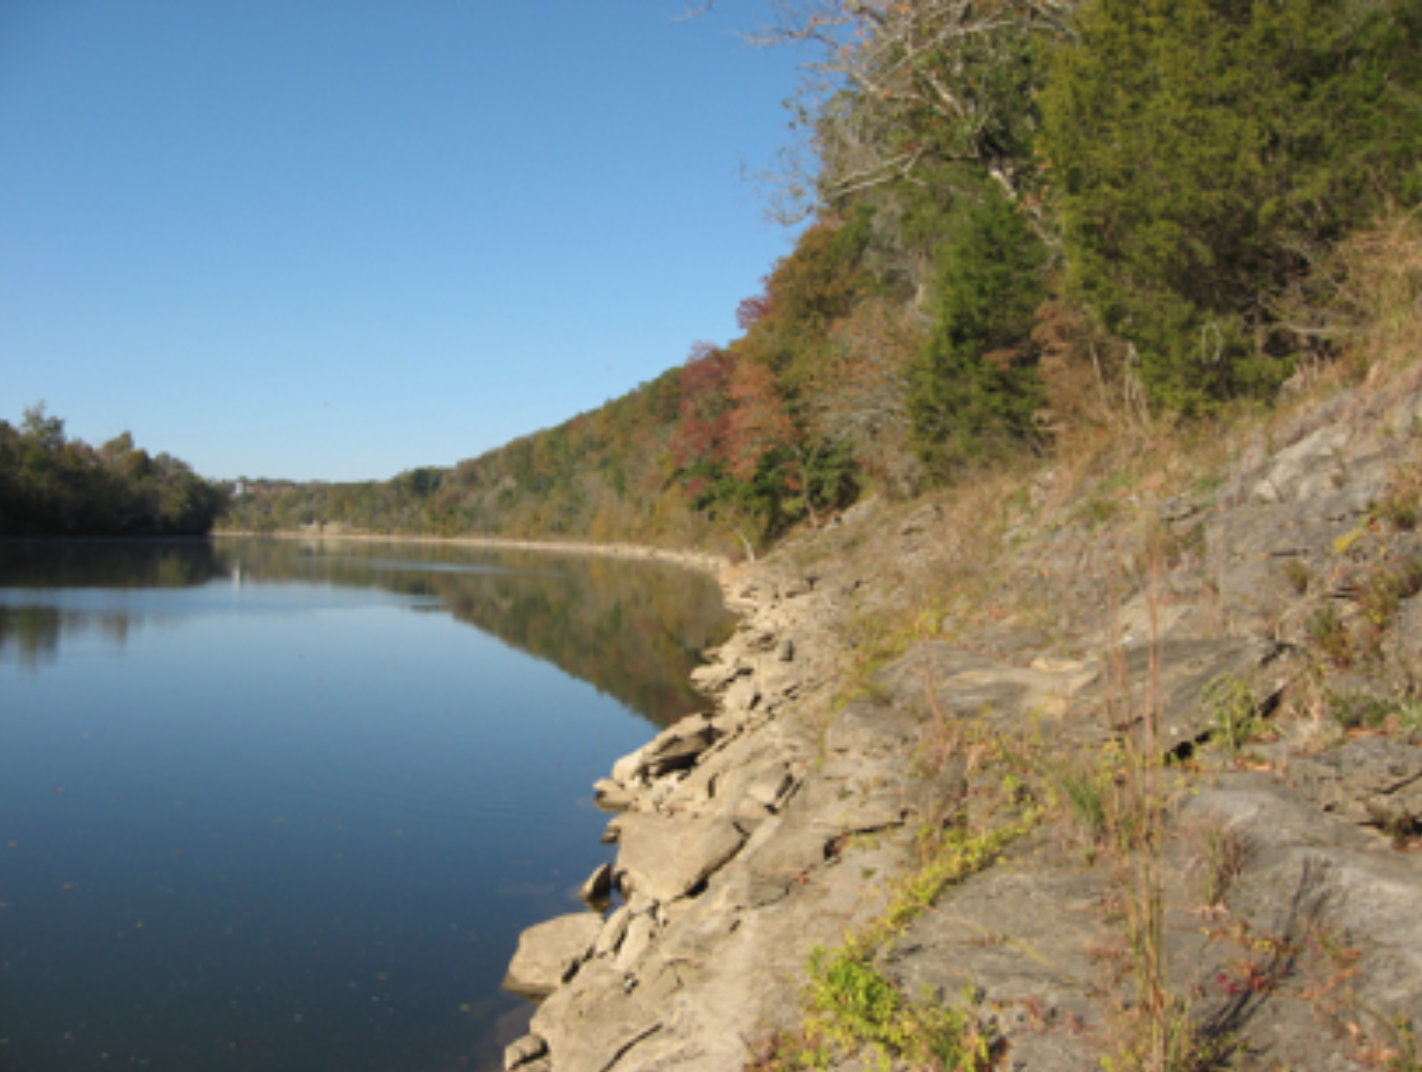
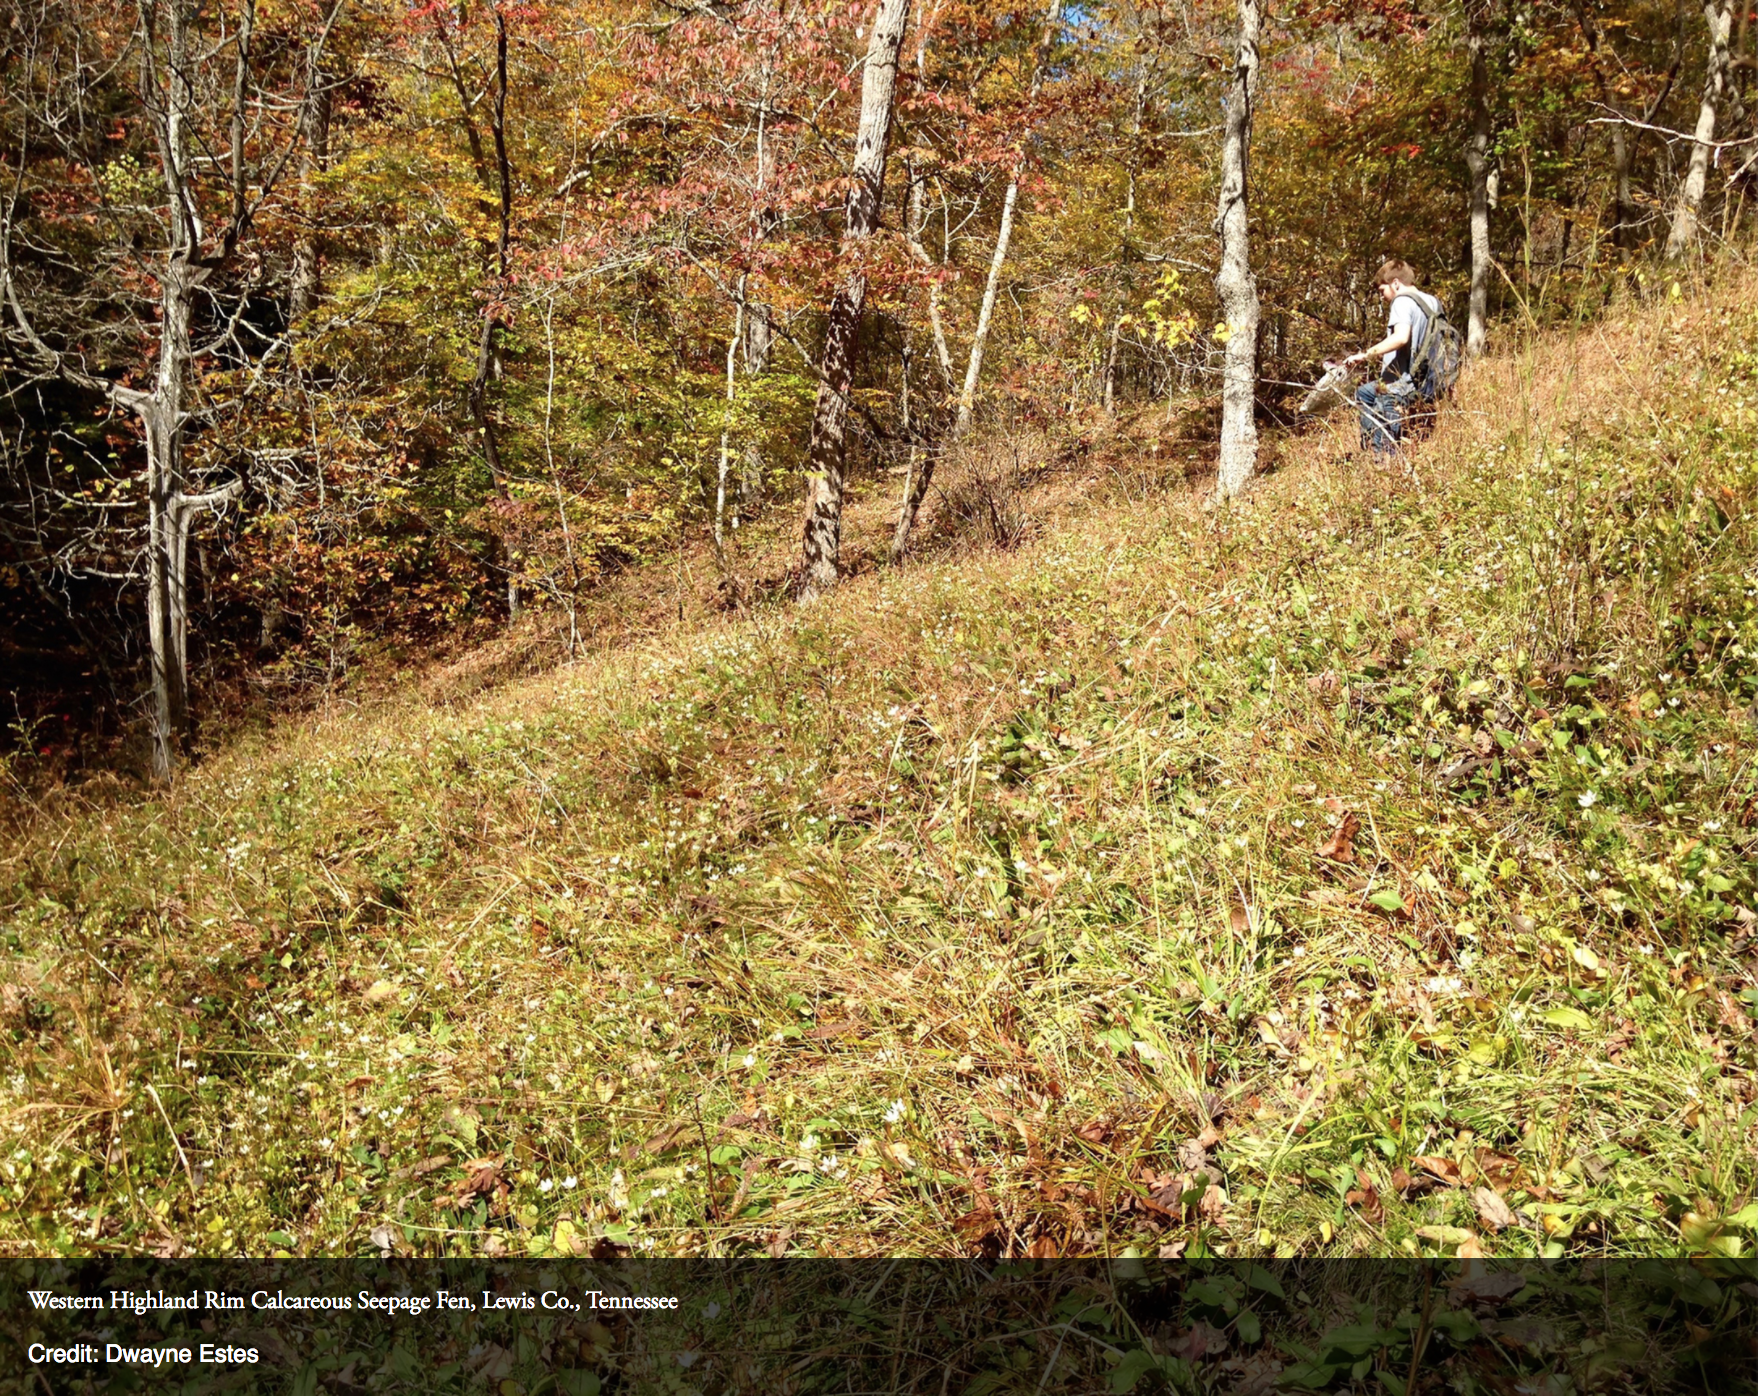
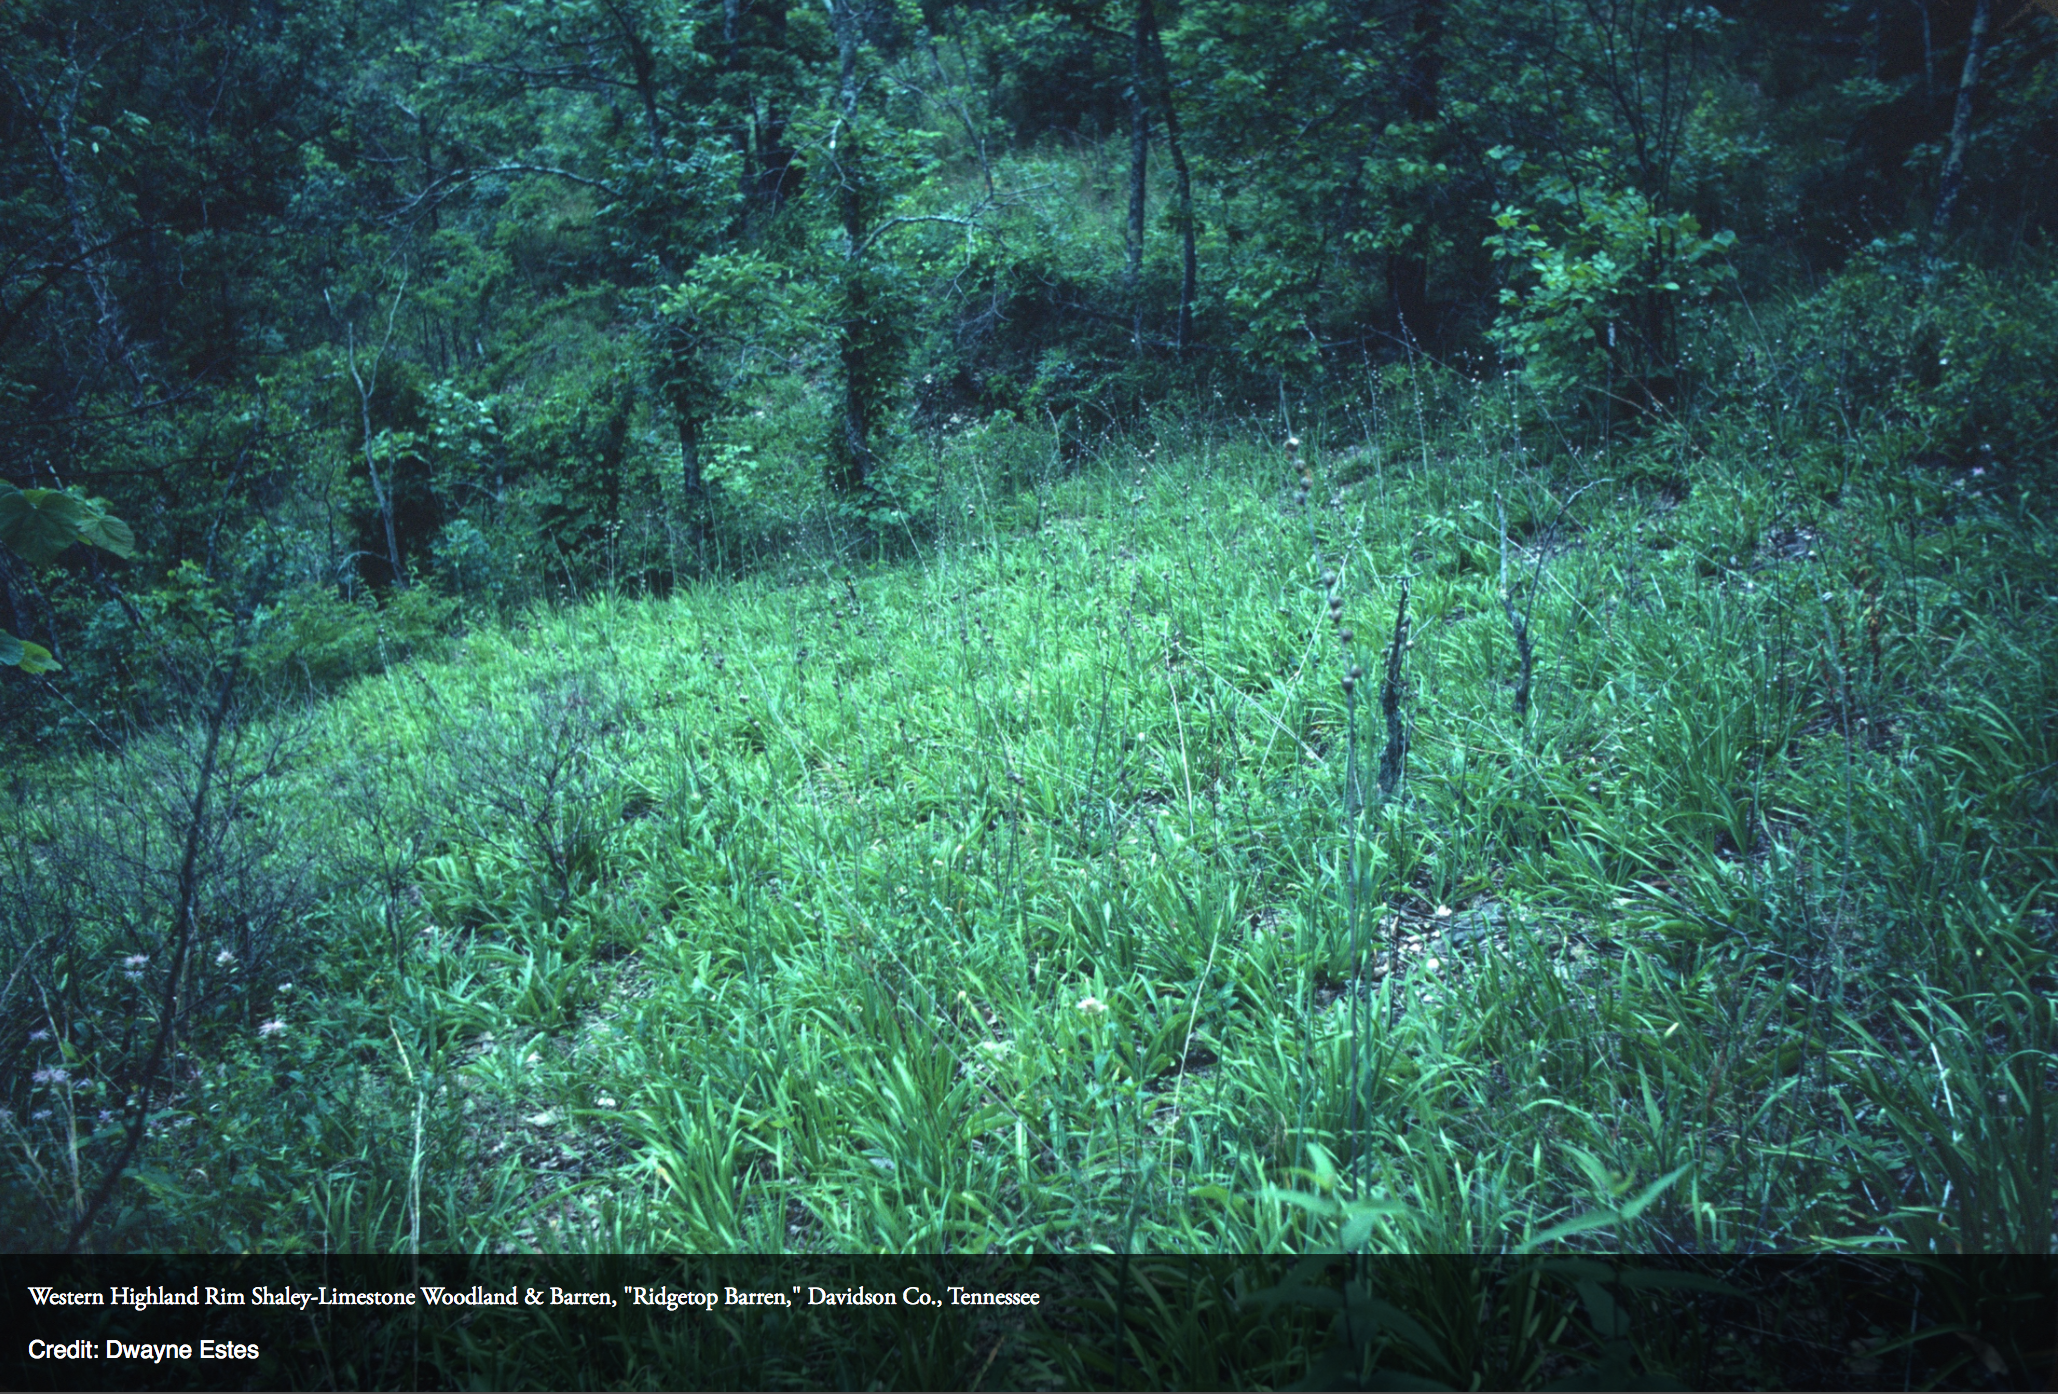
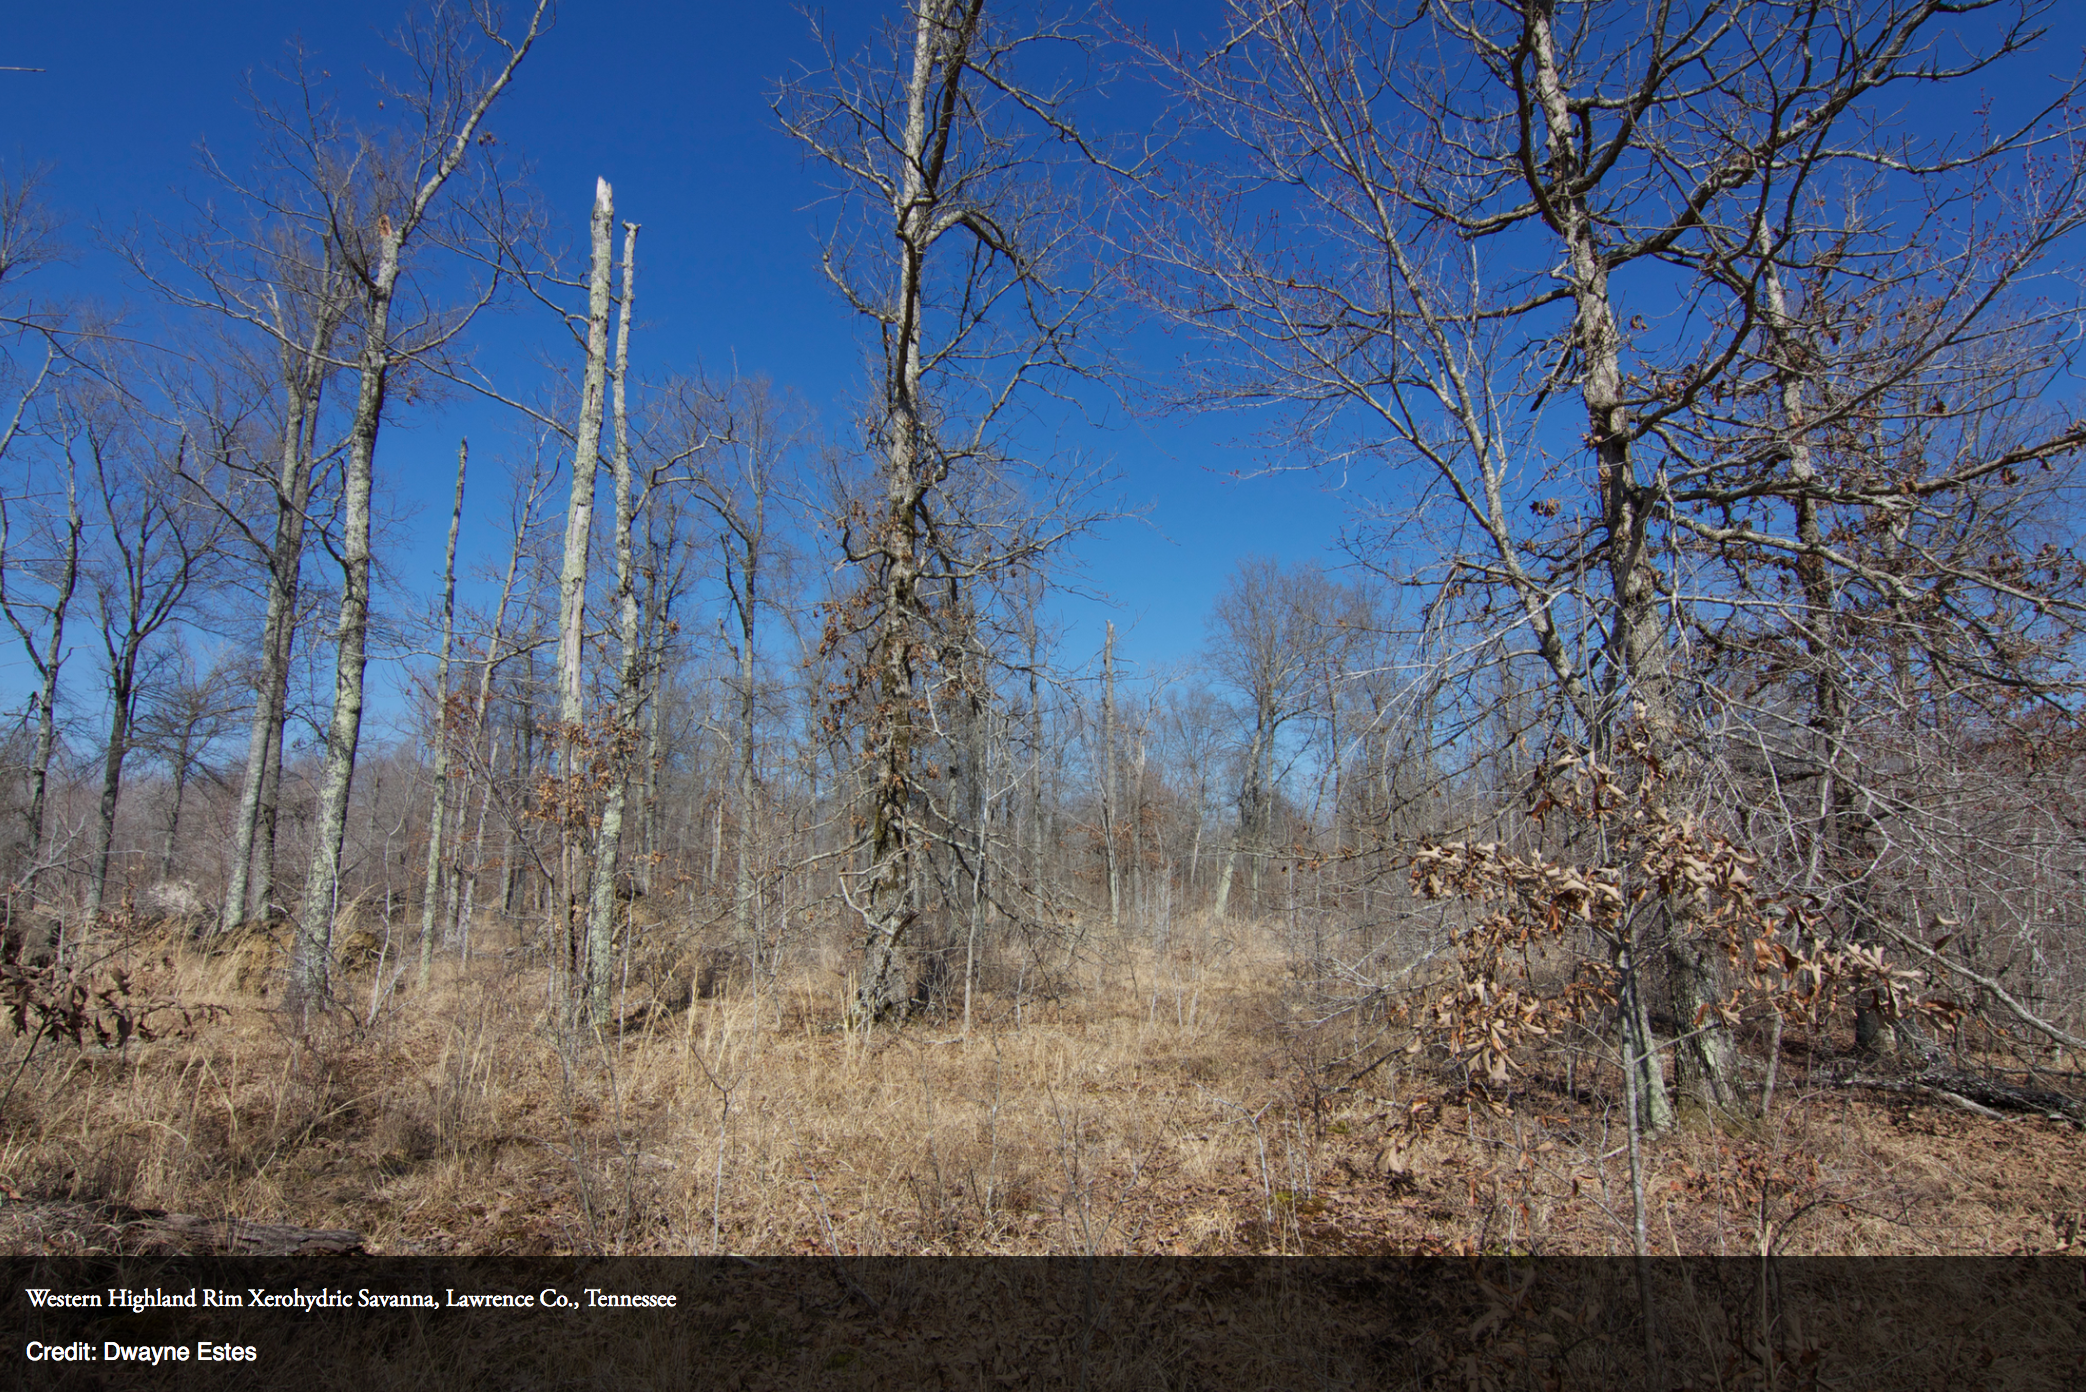
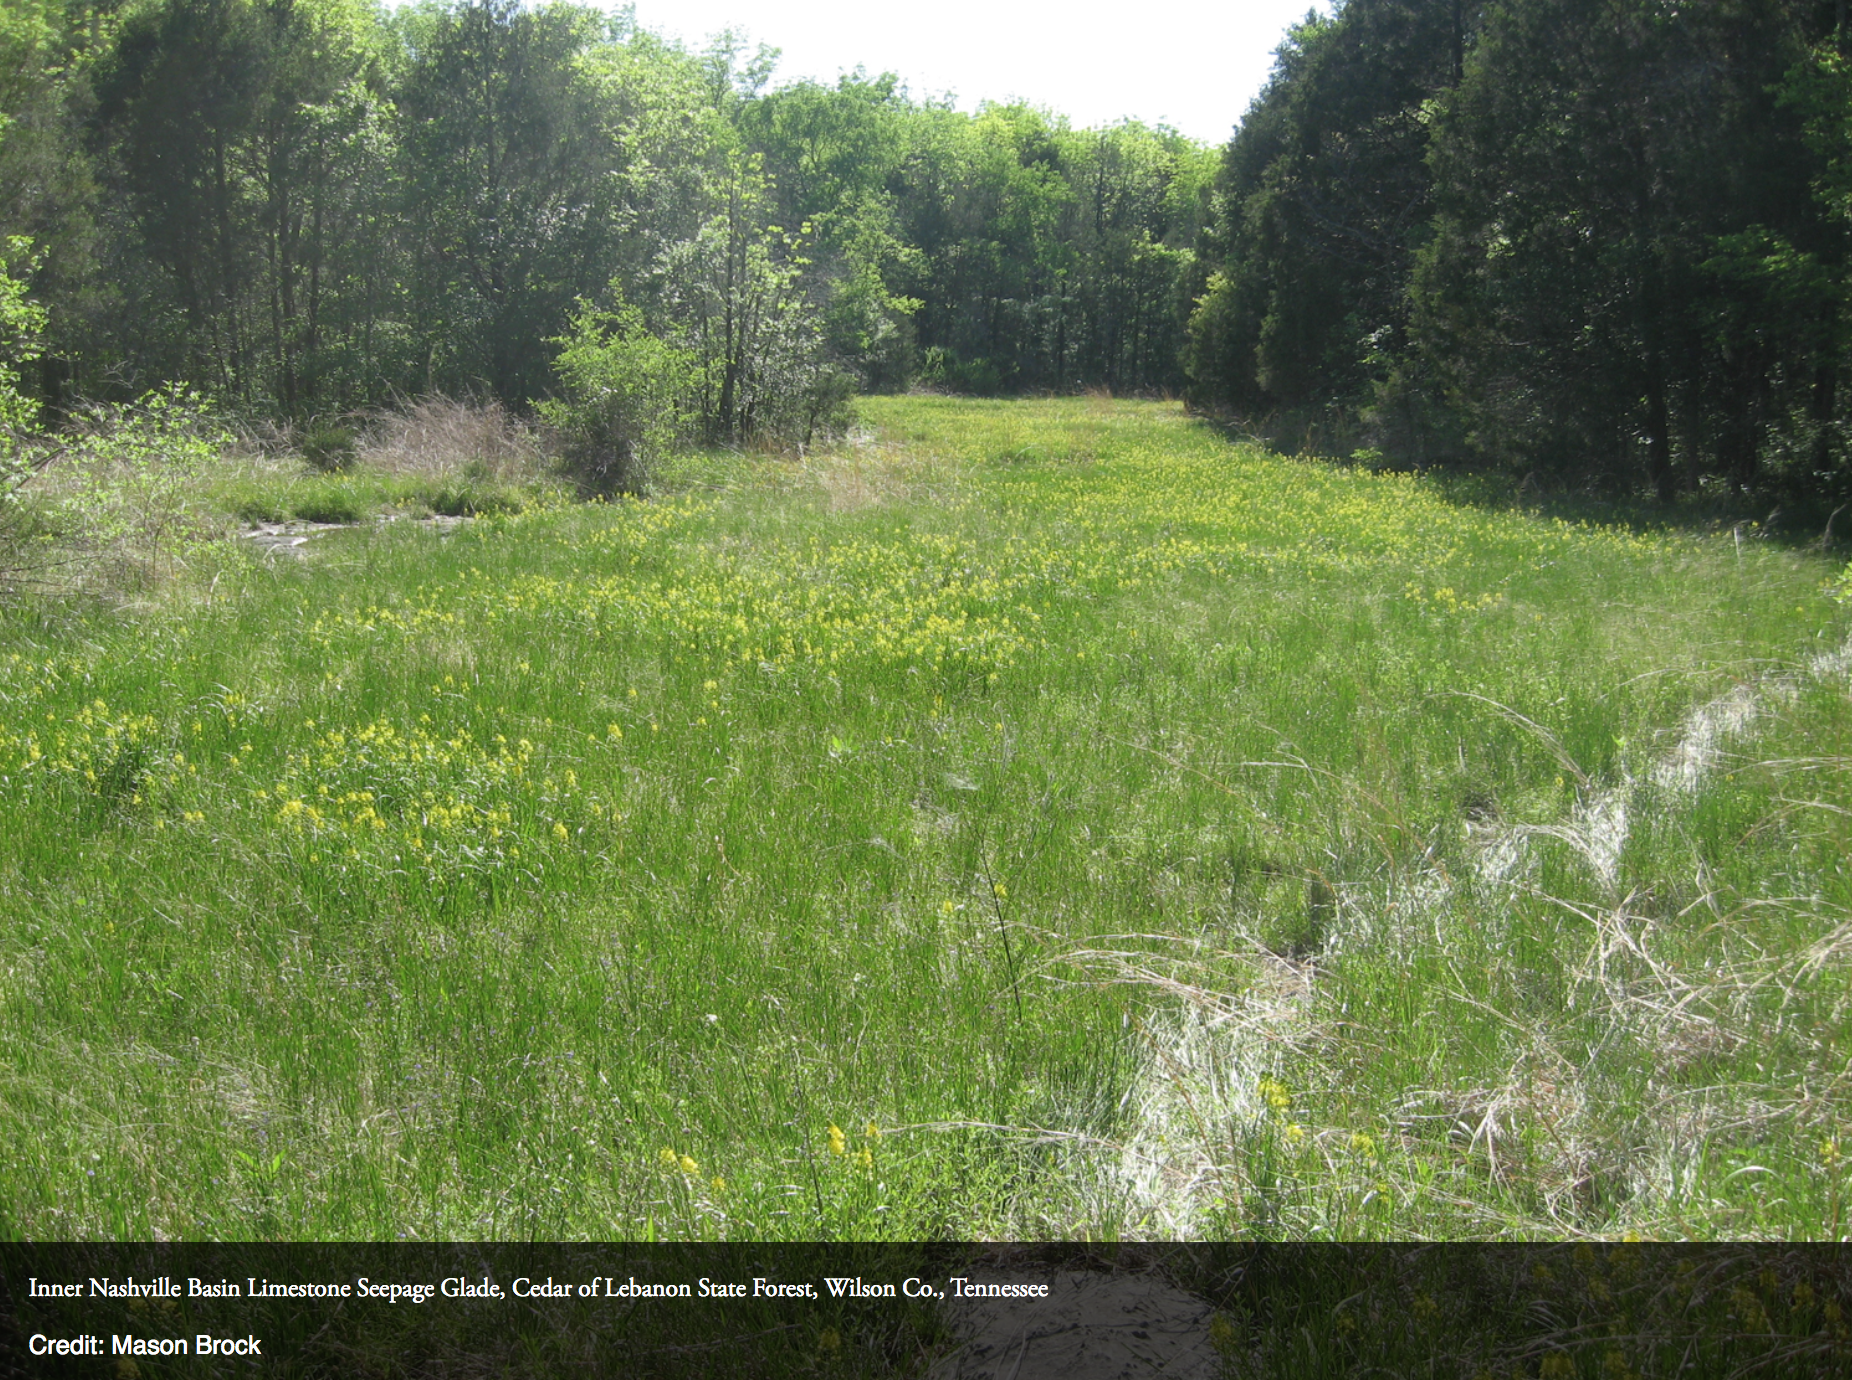
Click on the Photo Icon and View Site Photographs Per Site
View Historical Data Such as Historical Quotes

"open limestone glades 5 miles south of Chattanooga" Haywood (1887)
Click on the "Butterfly" Icon and View Species Records Per Site


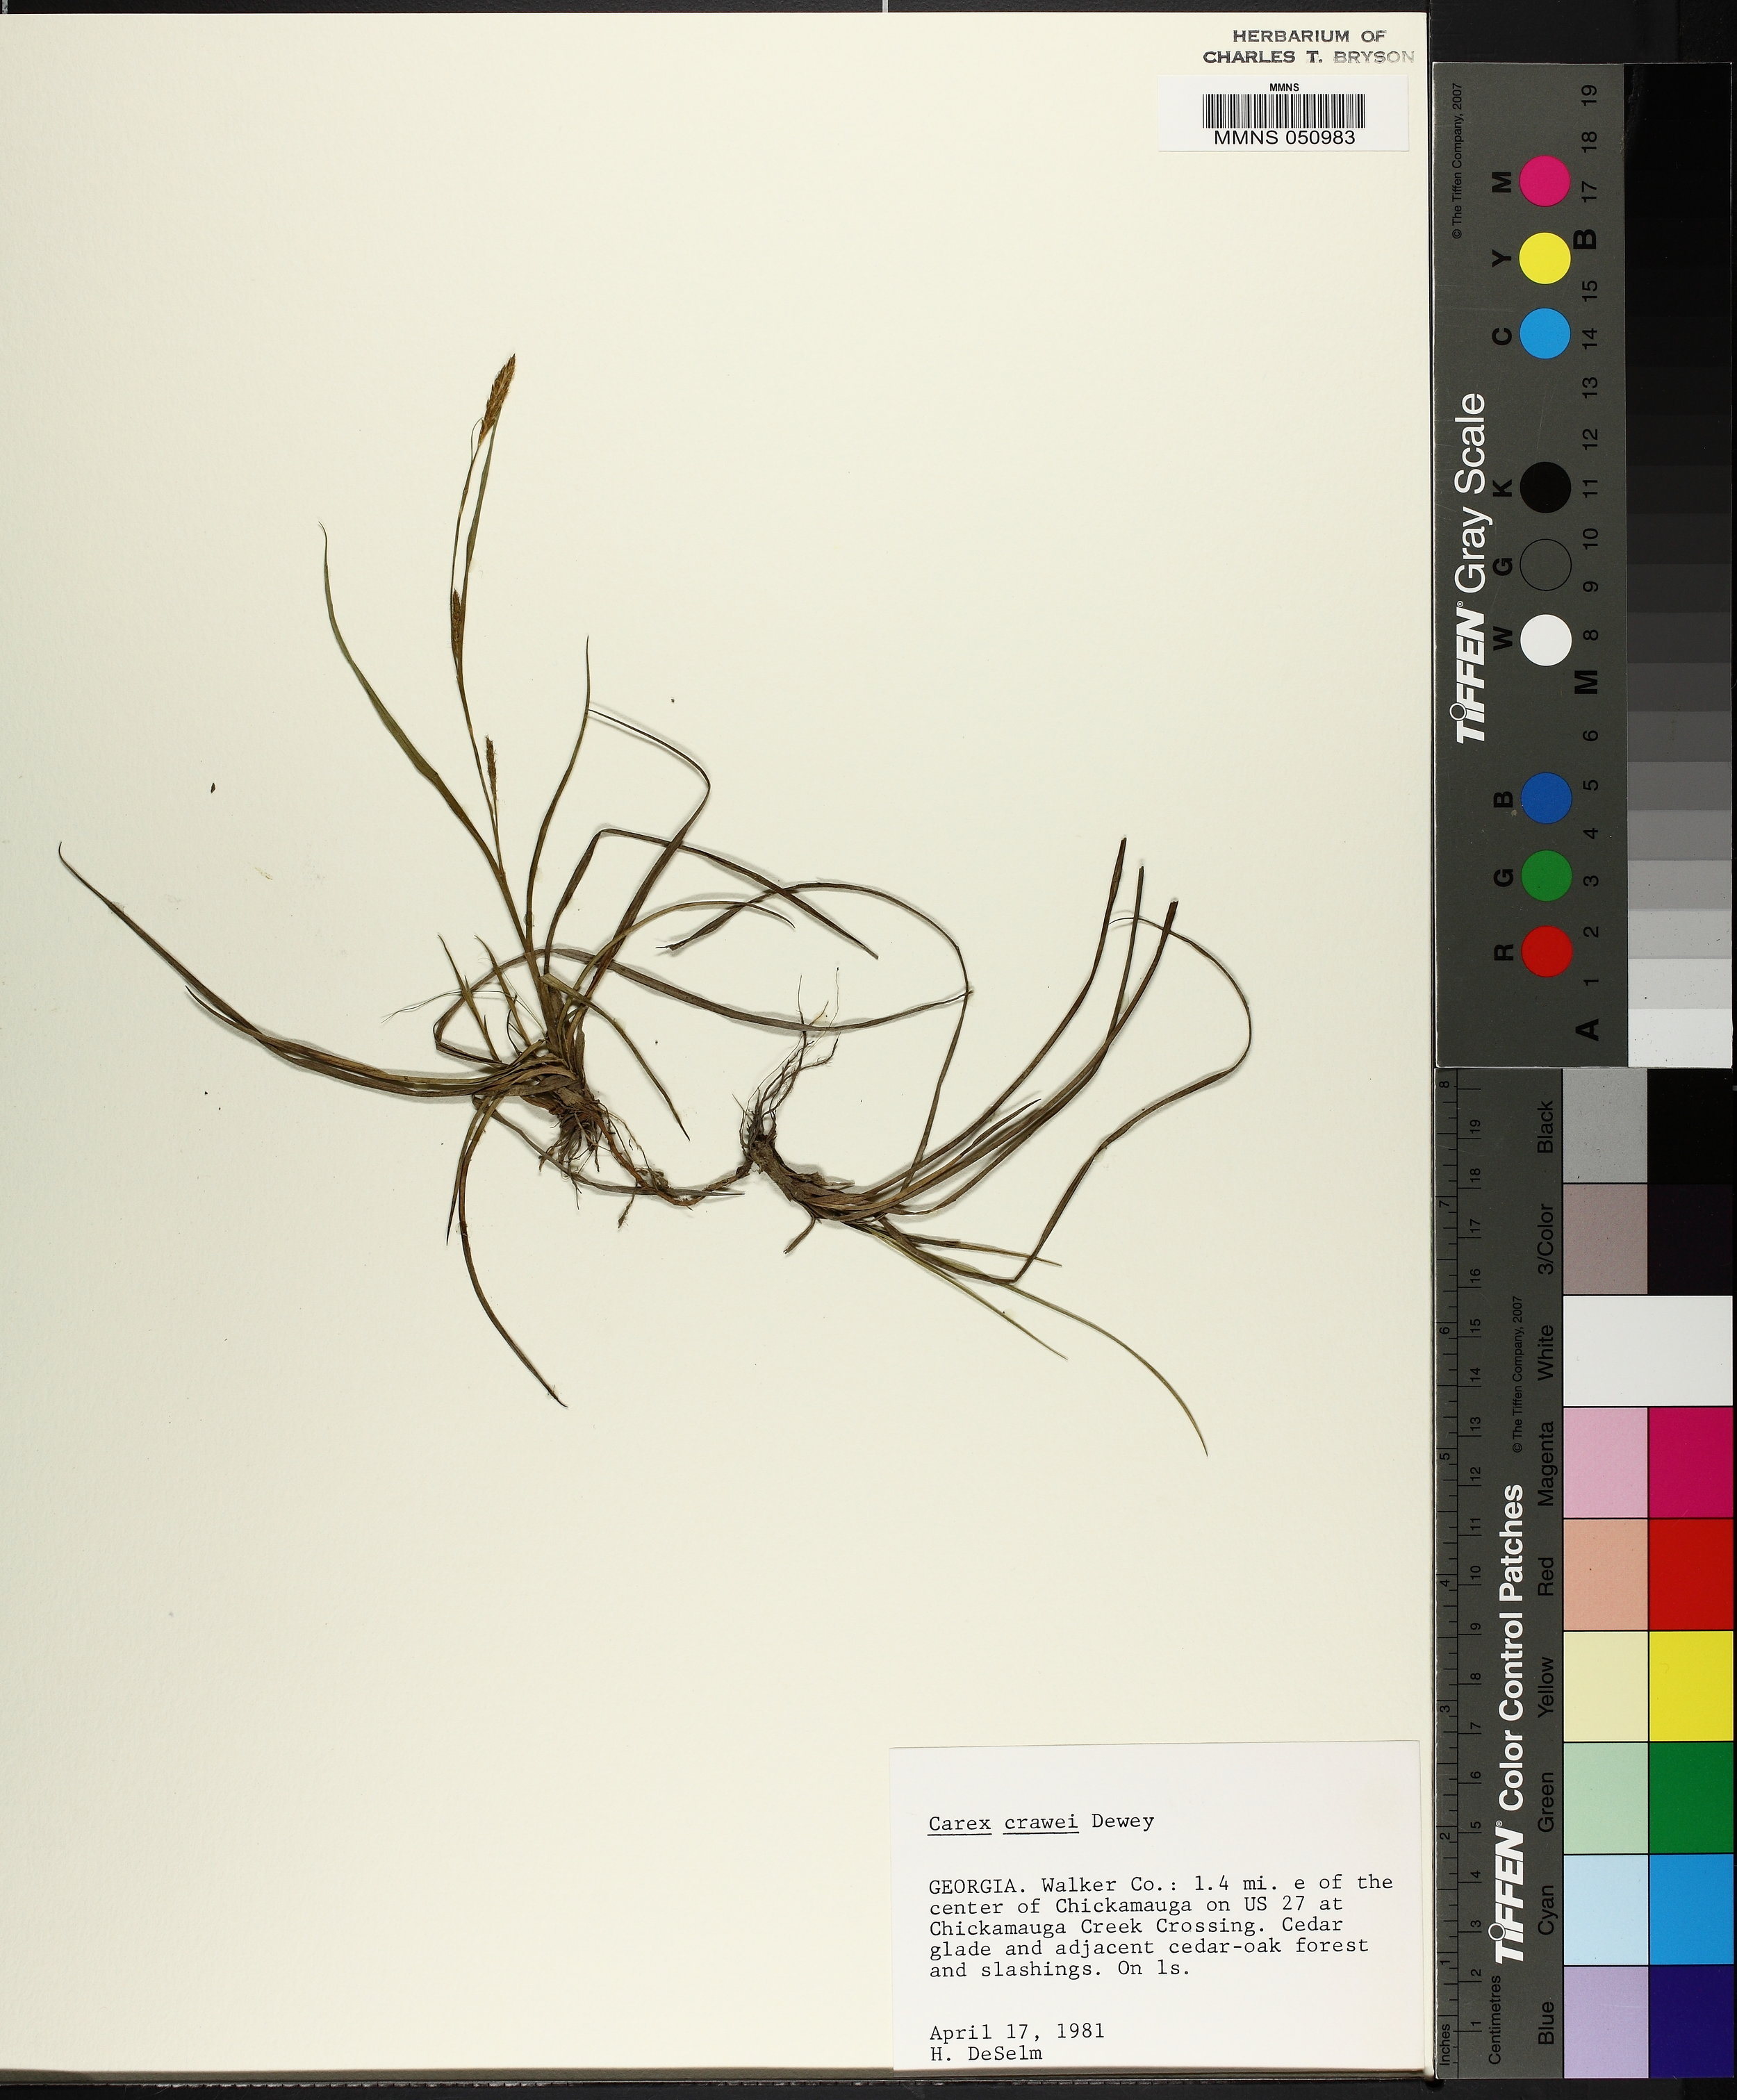


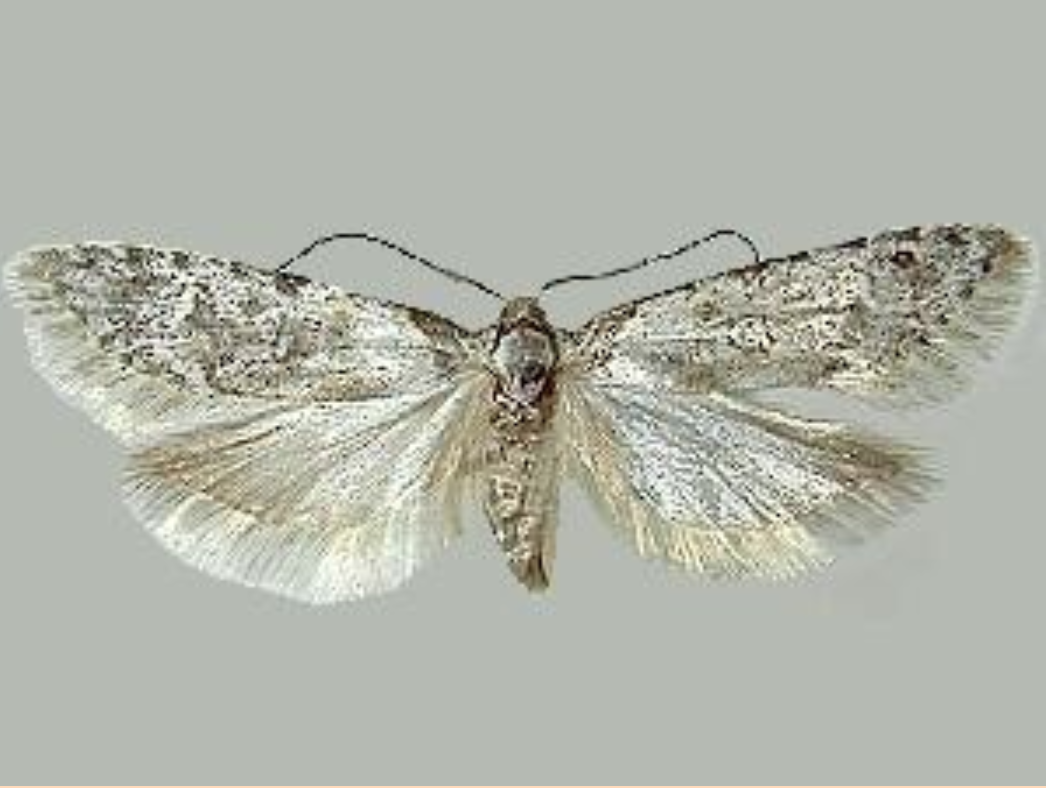


Species records will be derived from a variety of datasets including (1) NatureServe and State Natural Heritage Program Biotics Database; (2) SERNEC Herbarium Specimen Portal; (3) various museums such as Mississippi Entomological Museum; (4) VertNet for vertebrate animals; and (5) iNaturalist, etc. Clicking on each specimen record would take you to original data sources.
View iNaturalist Records Per Site

II. Remote Vegetation Mapping


Offer an assortment of base maps which can be overlaid to allow for mapping directly into the database (satellite, infrared, topo, soils, wetlands, landfire, landform, SEGAP - consider Ecozone?)
Offer a swipe tool for easily switching back and forth between types (as in ArcGIS)
allow for mapping various accessory attributes such as herbarium specimen records, etc., features that help identify grassland patches (SERNEC, VertNet, archaeological records???)
mapping feature with appropriate labeling tools to allow for mapping polygons, points, etc. and labeling
different accuracy settings
allow for associating attribute data with mapped grasslands
quotes
species lists
photos
documents/notes


III. Identify Grassland Types
As you zoom into a given region
possible grassland types (and species - see below) are automatically filtered down
clickable sets of attributes based on field observations to facilitate identification
community pages offering descriptions of abiotic and biotic attributes
show representative sites function
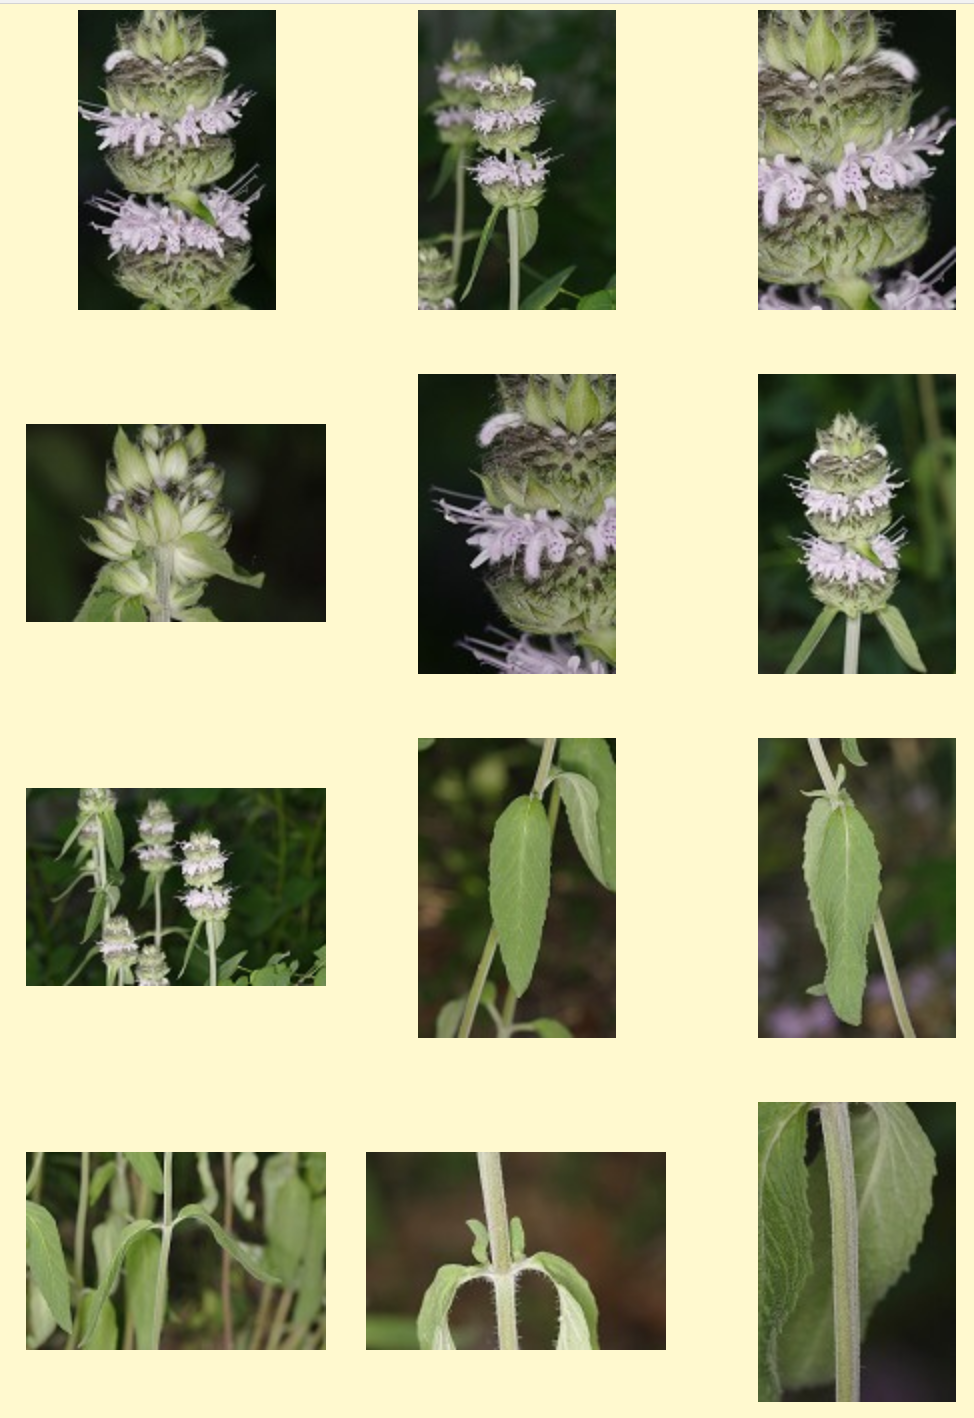
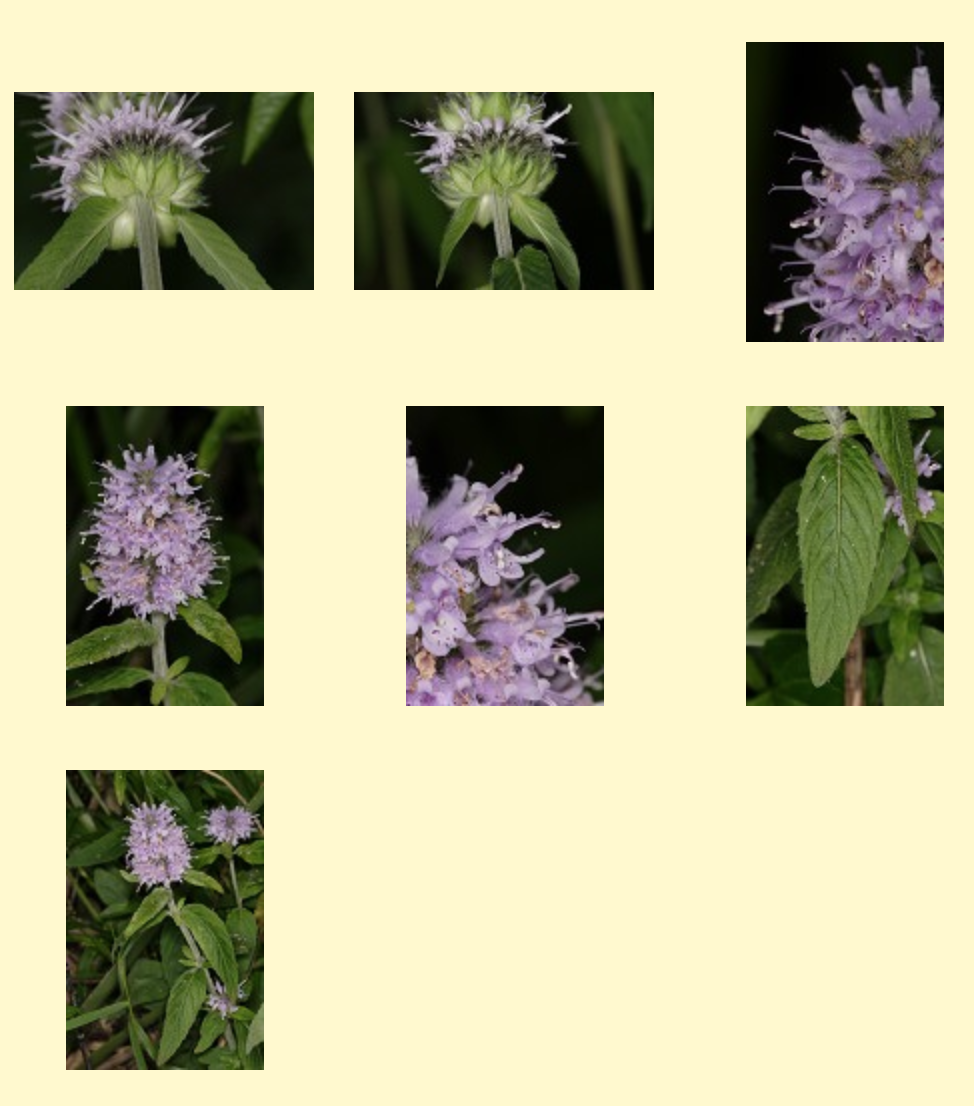
show photo galleries of each type
biological attributes of each type automatically filter out so you can see species per community type, plots per type, abiotic and biotic attributes of each type, geographic distribution of each type

Above: Ideally, the entire SGI focal area would be modeled using a combination of data sets to produce a vegetation map of the SGI area. As you zoom in on the map, the number of grassland types that occur within the search area decreases

Zooming in at the scale of #2 in the maps above results in about 15+ grassland types being identified.


Continued zooming to the scale of #4 reveals four grassland types of the Inner Nashville Basin.

Once a grassland type is identified, then you can see a profile page about that community complete with descriptions, photos. All of the known examples of that type are mapped. Can see rare species of that type, or invasive species of that type, or total flora and fauna.
IV. Database of Grassland Species
as you filter down to the community, it also filters down possible species per region or site
species can be additionally selected based on site's physical attributes


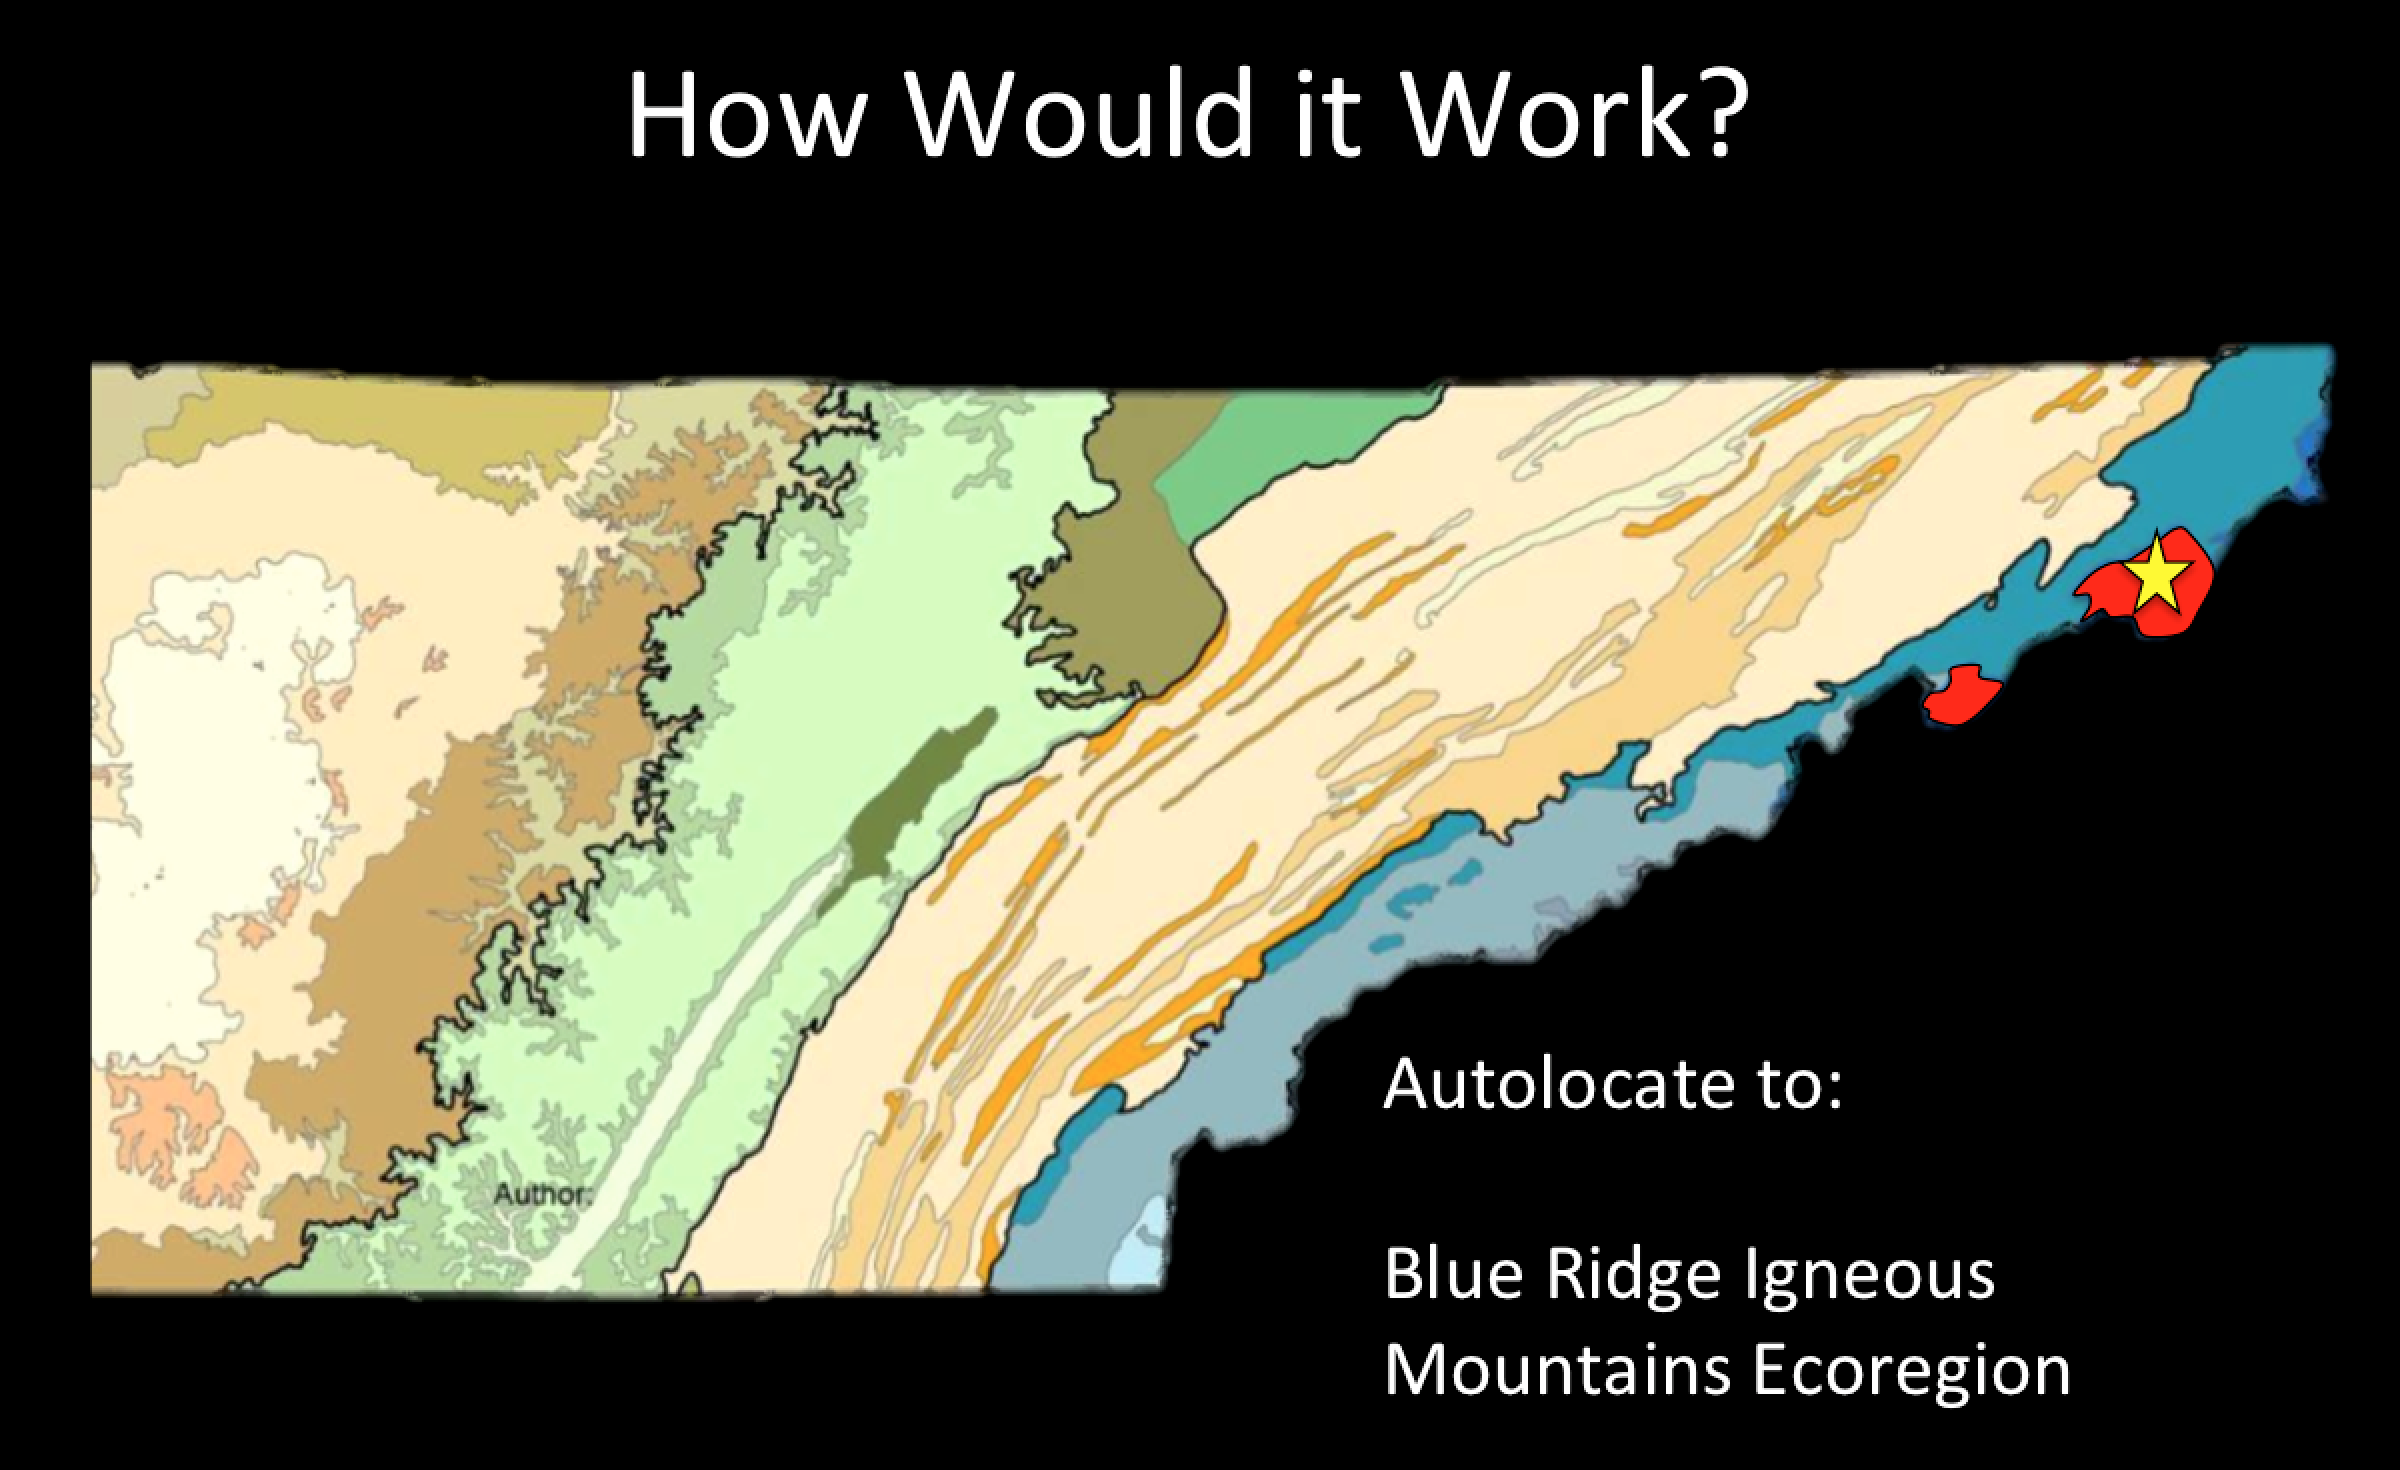
V. Data Entry Tool for Documenting New Sites

Field surveys result in discovery of new grassland
Mapping function to allow for polygons or points
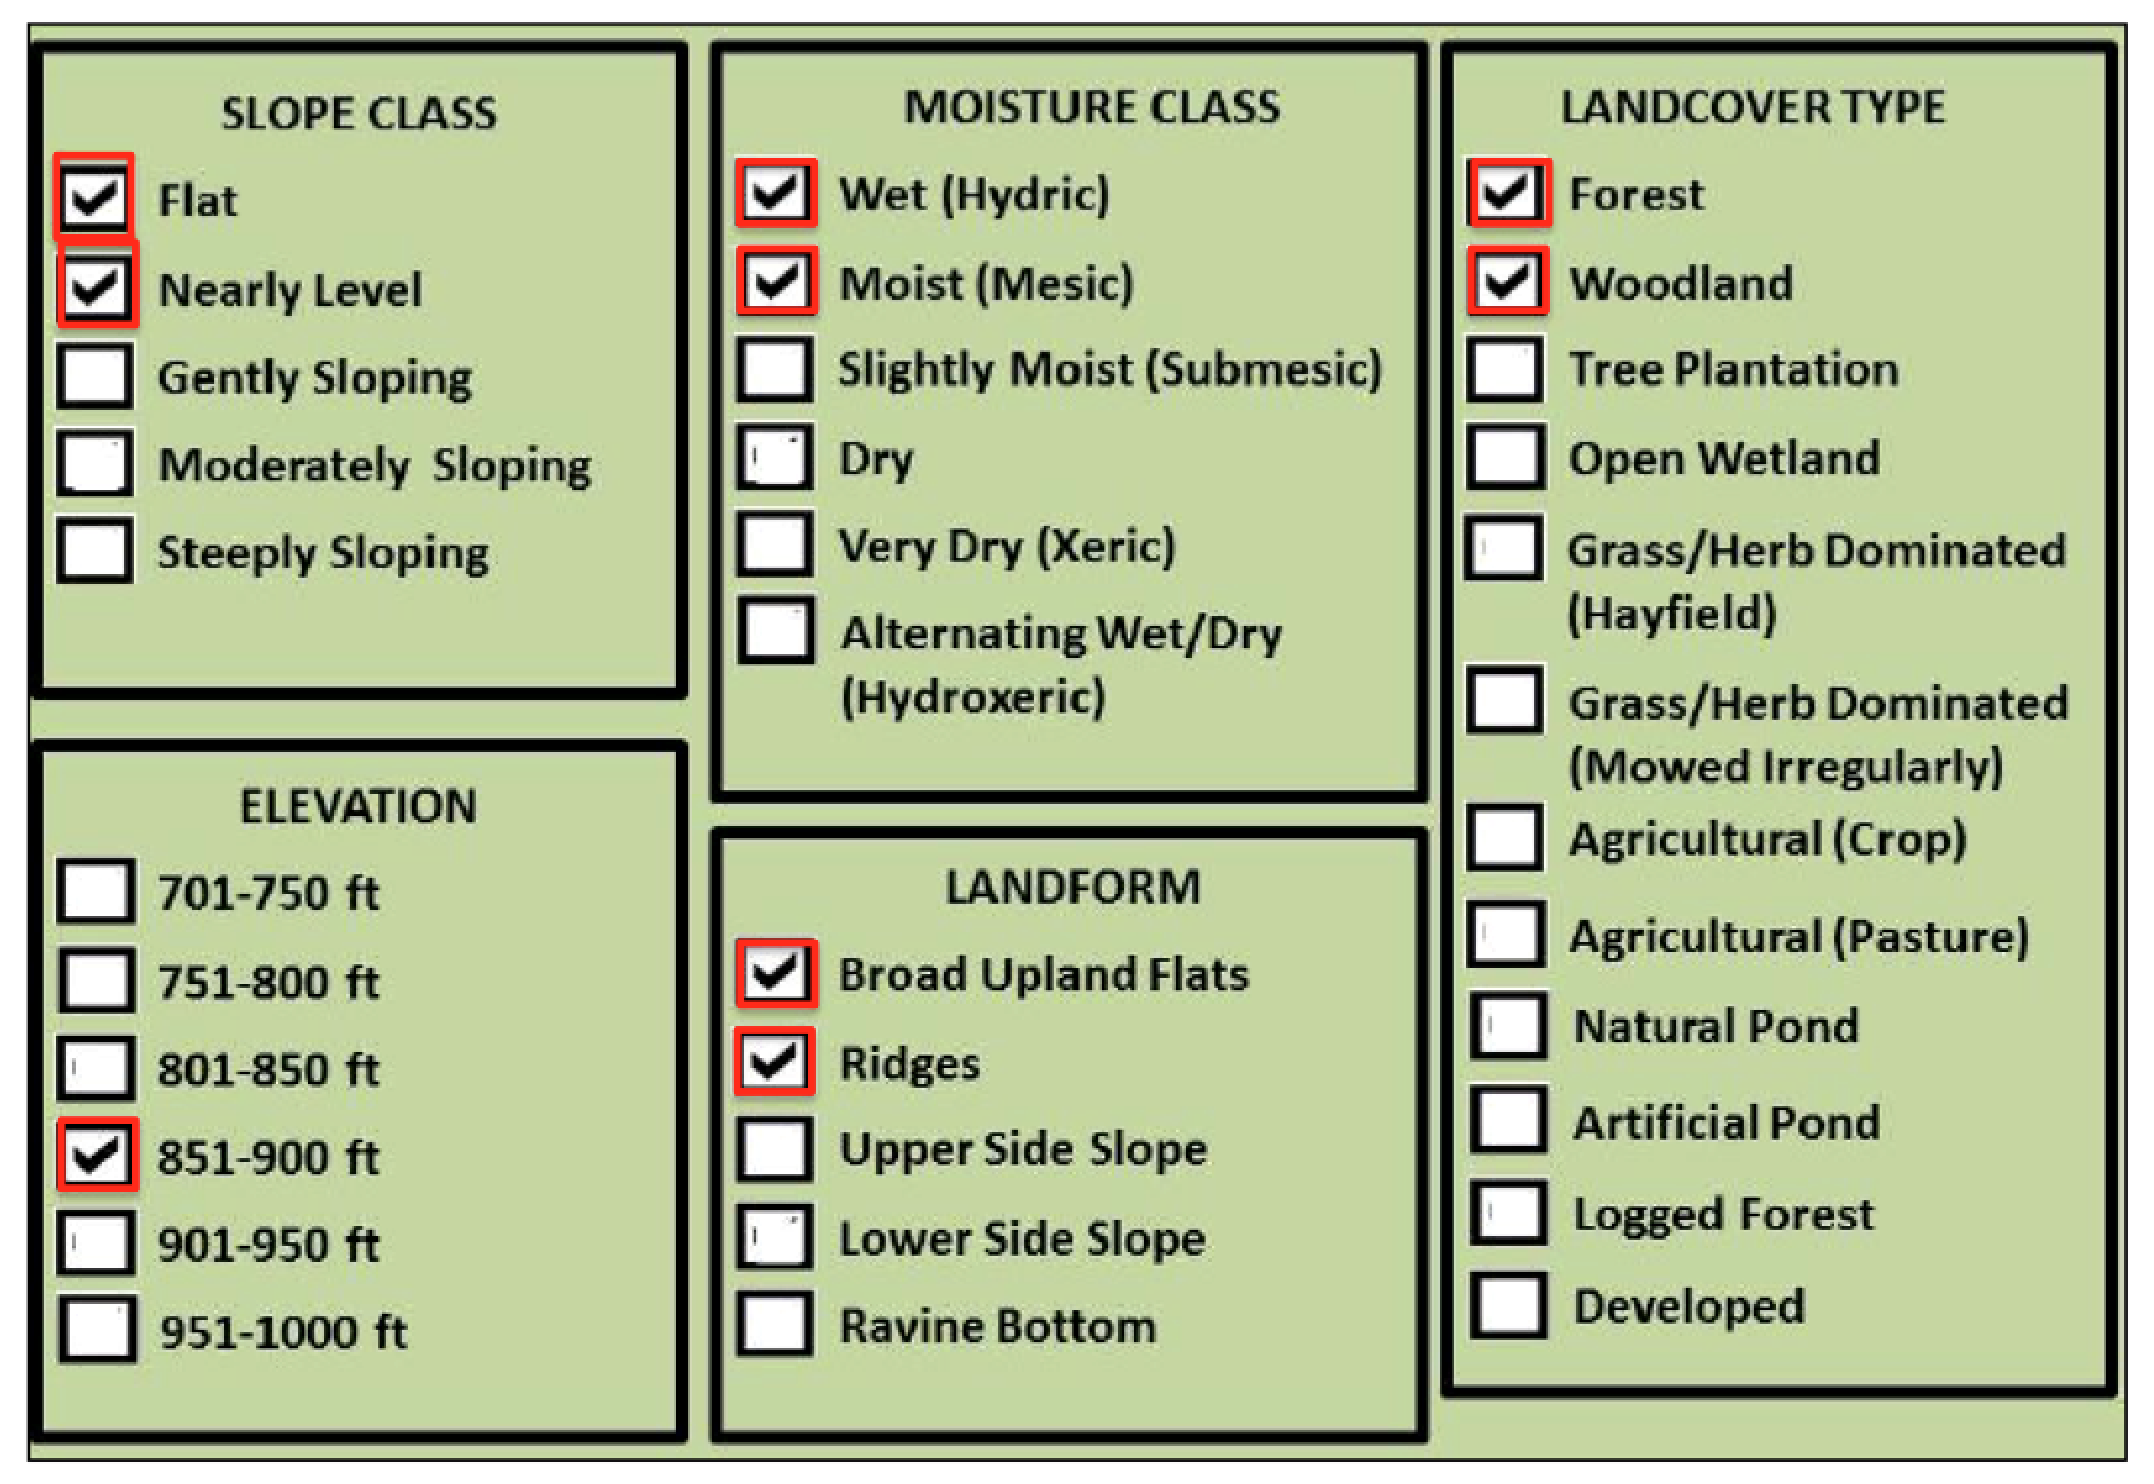
Tool for recording physical features (certain features autofill)
Tool for species documentation
Tool for vegetation documentation
Tool for photographic upload
Tool to attach other files (photocopies of site reports)
Administrators & data manager would manage site
Users with passwords would be able to upload data, but data would only be incorporated officially once vetted by admin